. 2015 Jun 1;113(10):3866-92.
doi: 10.1152/jn.00171.2013. Epub 2015 Feb 4.

Vestibular implantation and longitudinal electrical stimulation of the semicircular canal afferents in human subjects

Affiliations

Vestibular implantation and longitudinal electrical stimulation of the semicircular canal afferents in human subjects

James O Phillips et al. J Neurophysiol. .

Abstract

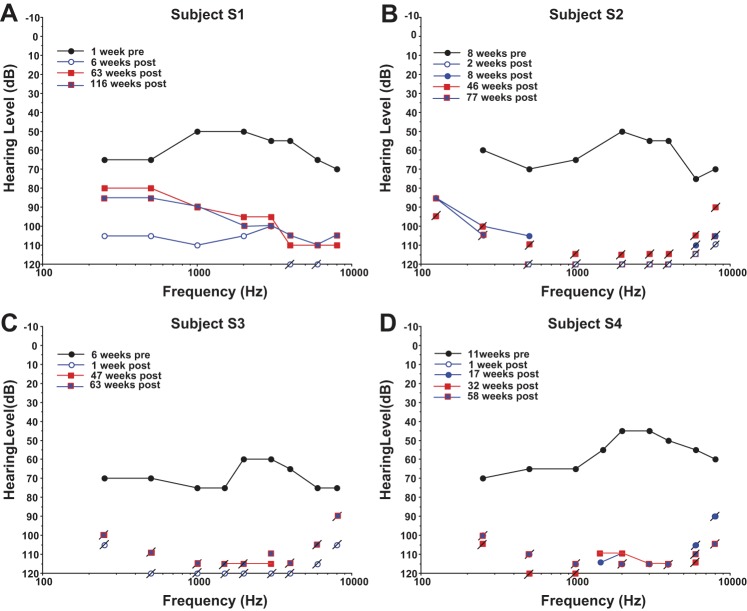
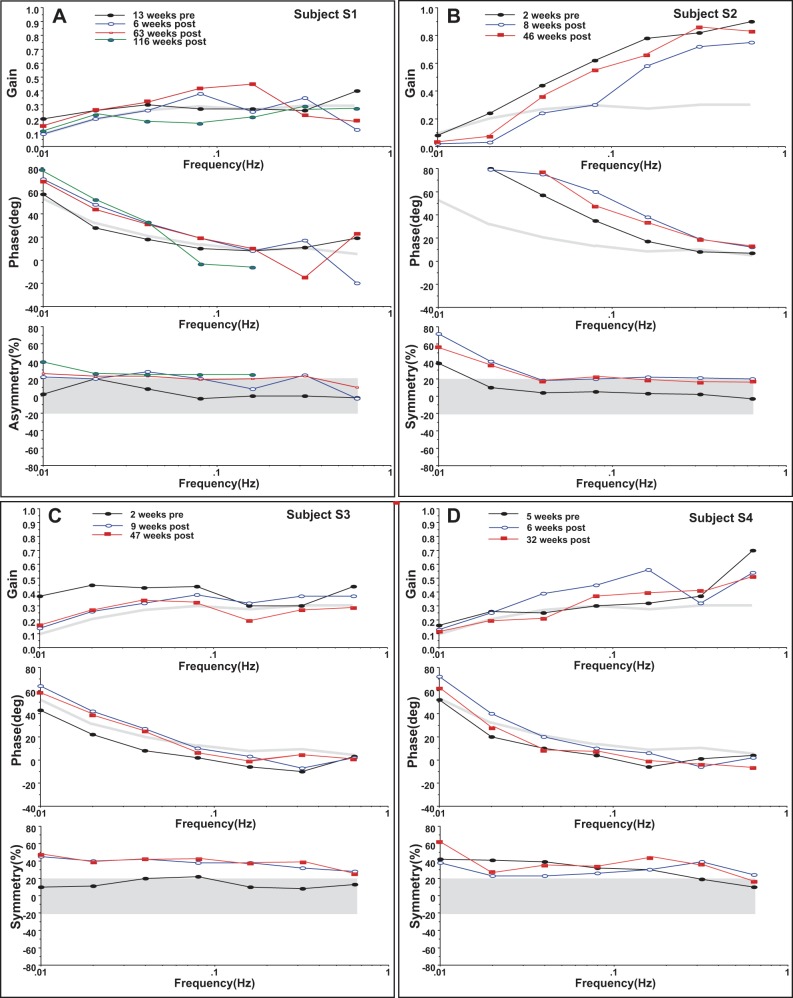
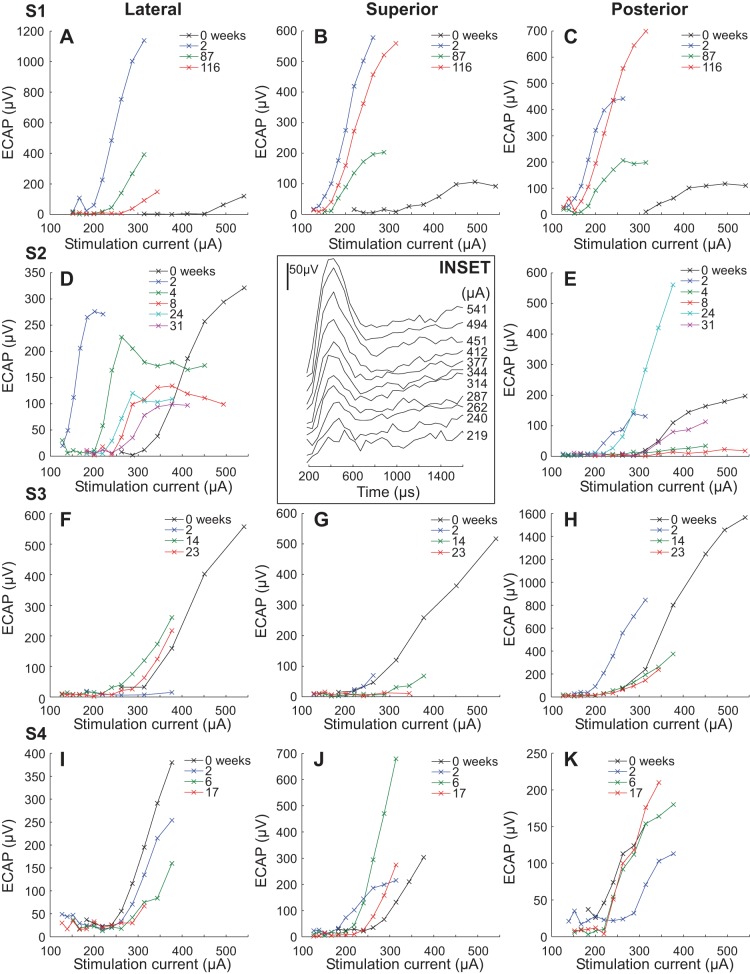
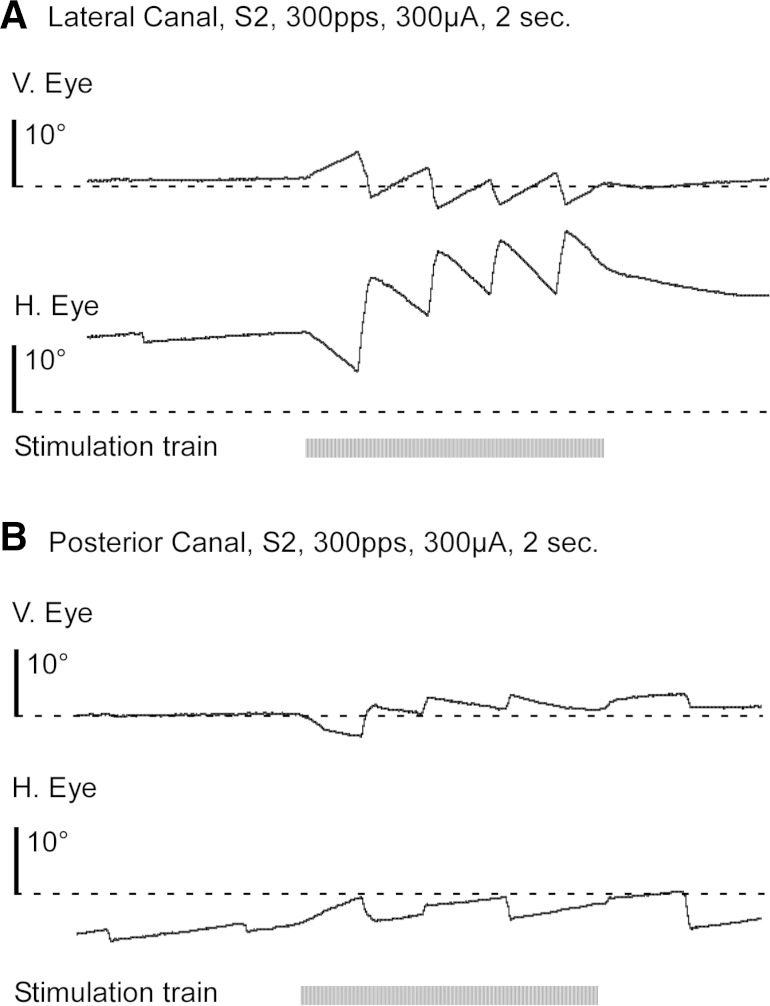
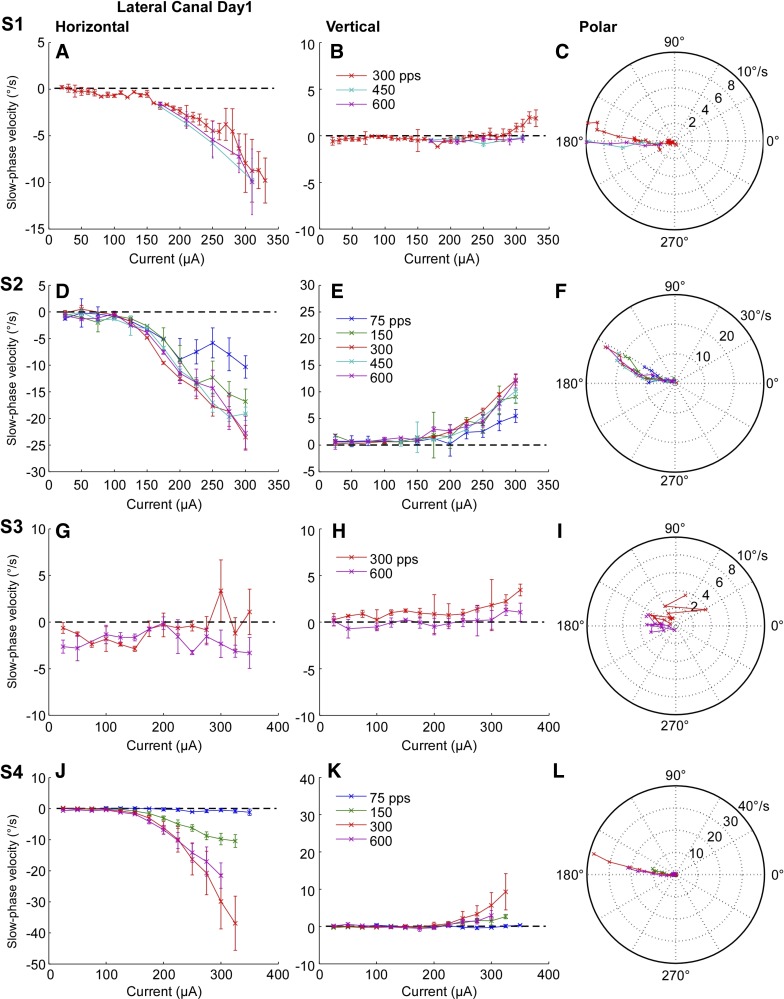
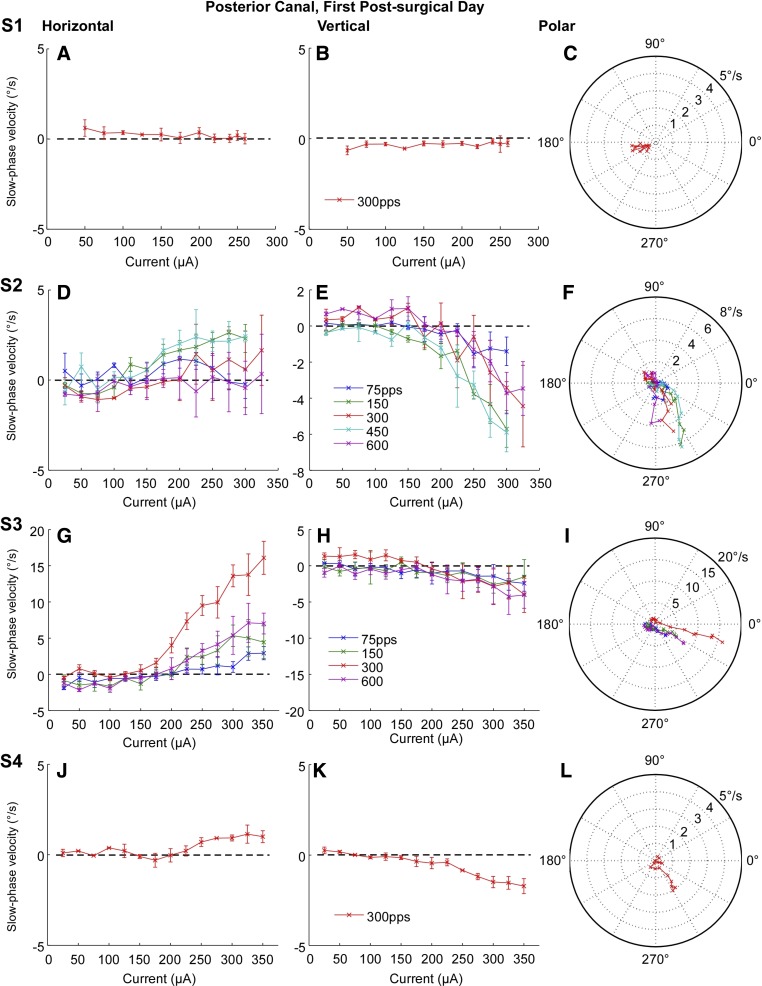
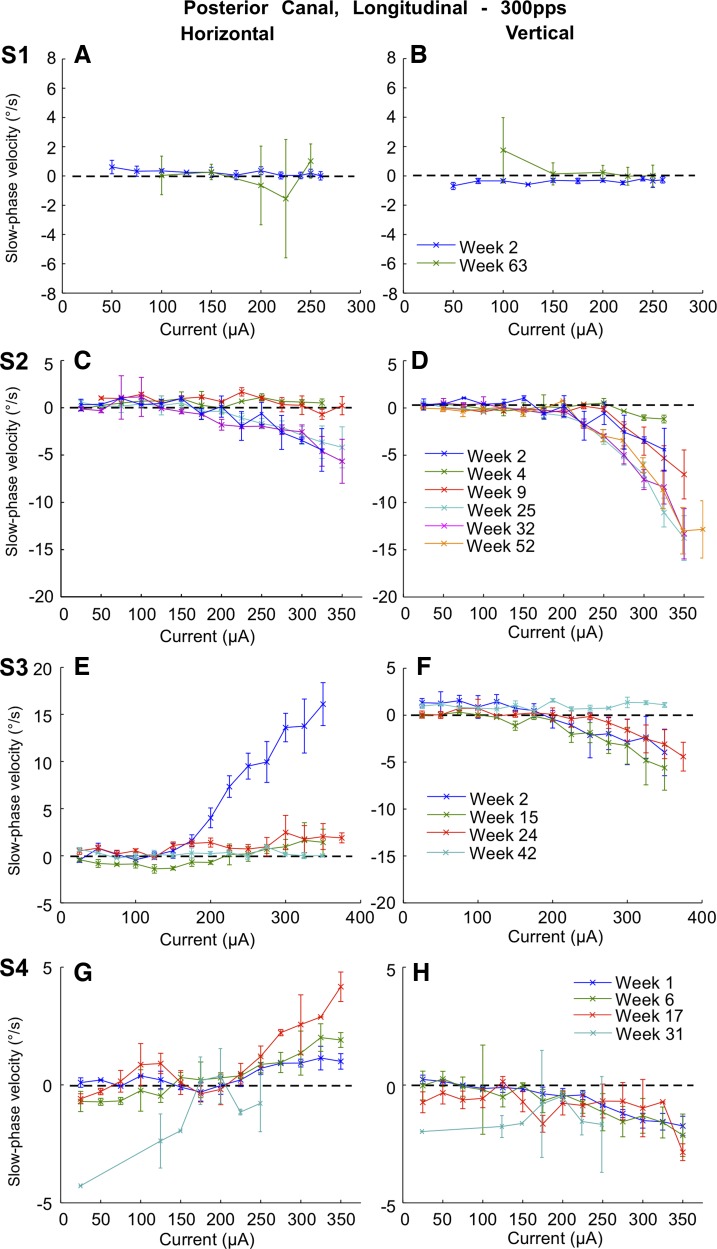
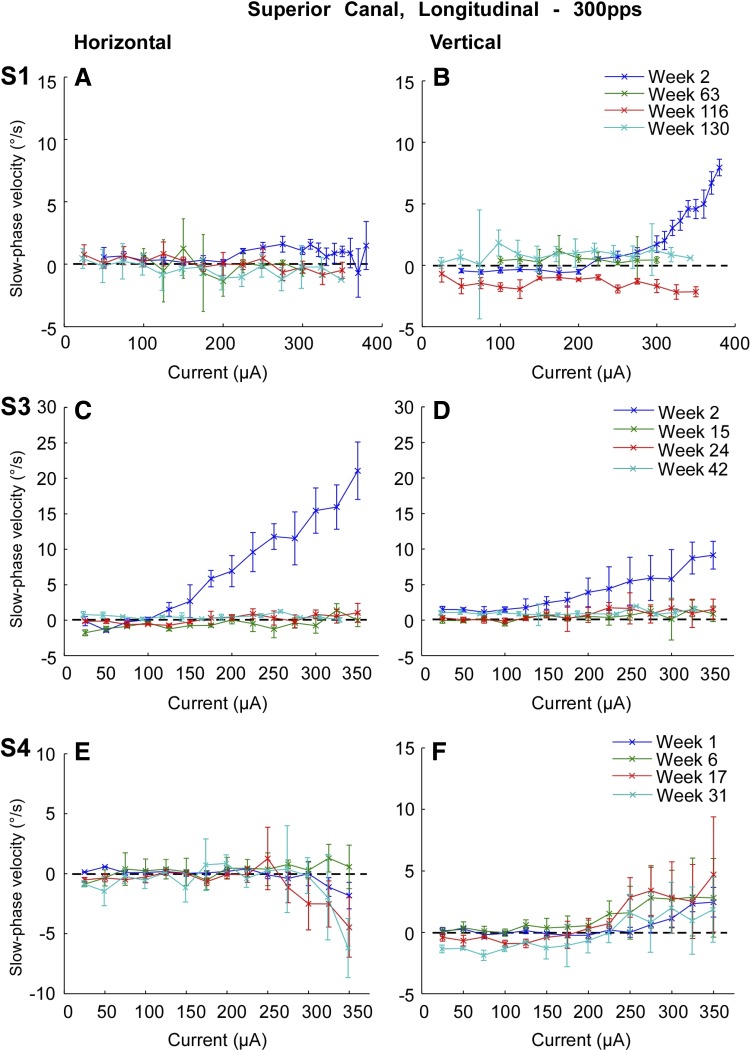
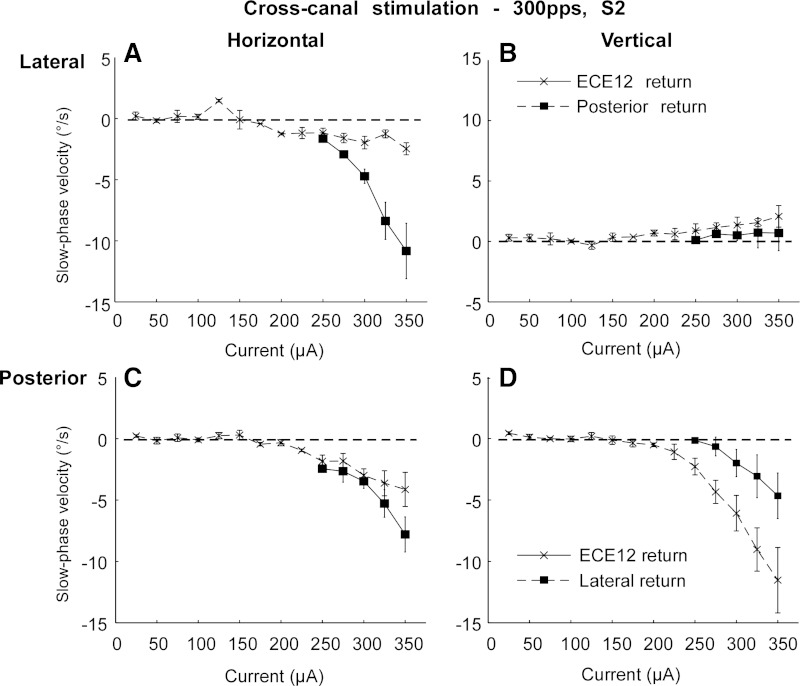
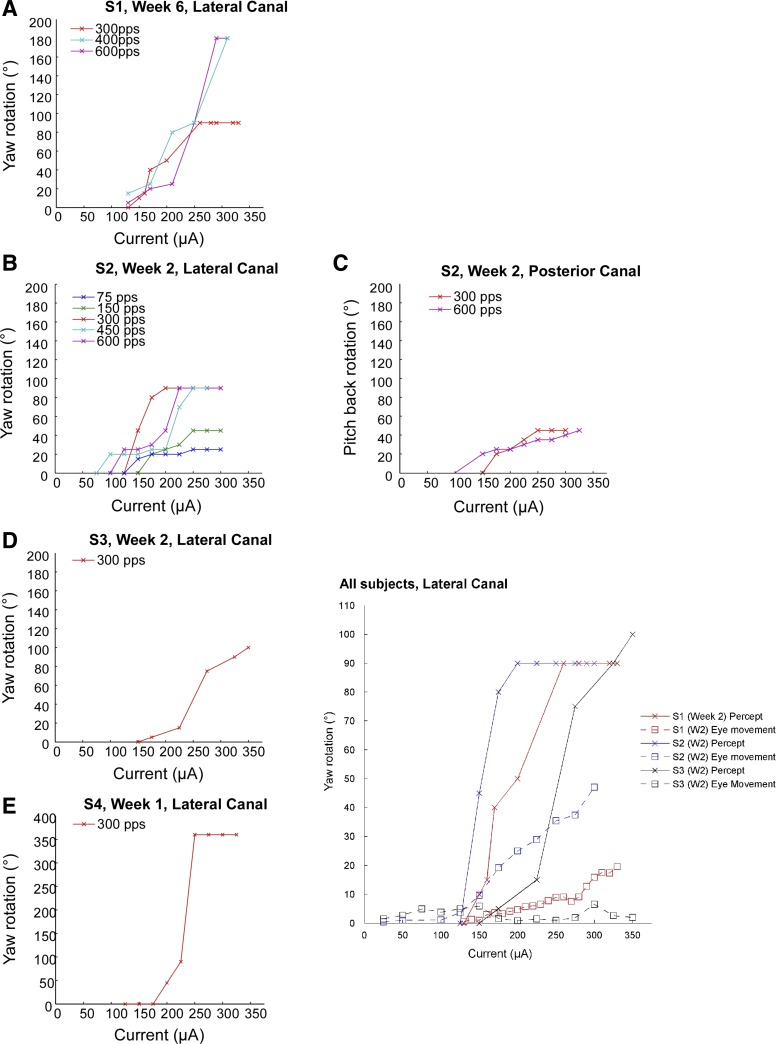
Animal experiments and limited data in humans suggest that electrical stimulation of the vestibular end organs could be used to treat loss of vestibular function. In this paper we demonstrate that canal-specific two-dimensionally (2D) measured eye velocities are elicited from intermittent brief 2 s biphasic pulse electrical stimulation in four human subjects implanted with a vestibular prosthesis. The 2D measured direction of the slow phase eye movements changed with the canal stimulated. Increasing pulse current over a 0-400 μA range typically produced a monotonic increase in slow phase eye velocity. The responses decremented or in some cases fluctuated over time in most implanted canals but could be partially restored by changing the return path of the stimulation current. Implantation of the device in Meniere's patients produced hearing and vestibular loss in the implanted ear. Electrical stimulation was well tolerated, producing no sensation of pain, nausea, or auditory percept with stimulation that elicited robust eye movements. There were changes in slow phase eye velocity with current and over time, and changes in electrically evoked compound action potentials produced by stimulation and recorded with the implanted device. Perceived rotation in subjects was consistent with the slow phase eye movements in direction and scaled with stimulation current in magnitude. These results suggest that electrical stimulation of the vestibular end organ in human subjects provided controlled vestibular inputs over time, but in Meniere's patients this apparently came at the cost of hearing and vestibular function in the implanted ear.

Keywords: Meniere's; human; implant; vestibular.


Figures

Fig. 1.
Fig. 1.
Pure tone thresholds in the right (implanted) ear in dB HL for all subjects at different time points before (pre) and after (post) surgical implantation of the vestibular stimulator. Connected lines indicate data for sound levels at threshold. Slashed points indicate sound level limits of the audiometer for tones that were not at or above threshold.
Fig. 2.
Fig. 2.
Sinusoidal angular vestibulo-ocular reflex behavior pre- and postsurgically for all subjects. Filled black circles are presurgical values. Thick gray lines and shading indicate 2 SD limits for control values for the respective measures. Top panel for each subject is gain with the 2 SD lower gain limit displayed for comparison. Middle panel for each subject is phase with the 2 SD phase advance limit displayed for comparison. Perfectly compensatory phase is defined to be 0.0 degrees (deg). Bottom panel for each subject is gain symmetry with the ±2 SD normal limit shaded for comparison. Positive values indicate a rightward asymmetry; i.e., rotation rightward produces lower eye velocity. Symmetric responses have 0.0% asymmetry.
Fig. 3.
Fig. 3.
Velocity step rotational test results pre- and postsurgically for all subjects. A: step gains calculated as (−1) times the ratio of the velocity of the first slow phase to the step velocity. Leftward steps are indicated by lighter gray bars and rightward steps are indicated by darker (gray and black) bars. The subject and week of testing are indicated. Negative weeks indicate presurgical data. B: step time constants in seconds calculated from a single exponential fit to the slow phase velocity data with the same color scheme as in A. Post Right, postrotatory nystagmus after rightward rotation; Post Left, postrotatory nystagmus after leftward rotation; Per Right, per-rotatory nystagmus during rightward rotation; Per Left, per-rotatory nystagmus during leftward rotation. Note: all subjects were implanted in the right ear.
Fig. 4.
Fig. 4.
Caloric responses for all subjects. Left ear irrigation is indicated by lighter gray bars, and right ear irrigation is indicated by darker (gray and black) bars. Peak slow phase velocities in deg/s are plotted. Negative velocities indicate leftward slow phase eye movement. LC, 24°C irrigation of the left ear; LW, 50°C irrigation of the left ear; RC, 24°C irrigation of the right ear; RW, 50°C irrigation of the right ear. The subject and week of testing are indicated. Negative weeks indicate presurgical data.
Fig. 5.
Fig. 5.
Longitudinal recording of vestibular evoked compound action potential (vECAP) in all subjects. The amplitude of the recorded waveform is plotted against the stimulation current for different times (in weeks) following the surgery. The symbols indicate the week of the recording. Each row indicates data from a single subject, and each column indicates data from stimulation with a specific canal array. Insert: vECAP recording intraoperatively in subject S1. The stimulation currents are listed to the right of each trace. The amplitude calibration is 50 μV. Time is the latency from commanded stimulation onset in μs.
Fig. 6.
Fig. 6.
Representative traces of slow phase eye movement resulting from a 2 s train of 300 μA biphasic pulses (100 μs per phase and 8 μs gap) monopolar electrical stimulation at 300 pps in subject S2. Horizontal (H) and vertical (V) eye position are displayed as is the stimulation train (black horizontal bar). A: stimulation of the right lateral canal. B: stimulation of the right posterior canal.
Fig. 7.
Fig. 7.
Average slow phase eye velocity vs. stimulation current at different stimulus rates for 2 s trains of biphasic pulses applied to the right lateral canal on the 1st postsurgical test day. Rows show data from different test subjects. Columns from left to right display horizontal slow phase velocity vs. current, vertical slow phase velocity vs. current, and a polar plot of 2D eye velocity vs. current. Negative values indicate leftward or downward slow phase velocity. Error bars display ± 1 SD of the slow phase velocity of all slow phases collected over all trials.
Fig. 8.
Fig. 8.
Average slow phase eye velocity vs. stimulation current at different stimulus rates for 2 s trains of biphasic pulses applied to the right posterior canal on the 1st postsurgical test day. Rows show data from different test subjects. Columns from left to right display horizontal slow phase velocity vs. current, vertical slow phase velocity vs. current, and a polar plot of 2D eye velocity vs. current. Negative values indicate leftward or downward slow phase velocity. Error bars display ± 1 SD of the slow phase velocity of all slow phases collected over all trials.
Fig. 9.
Fig. 9.
Average slow phase eye velocity vs. stimulation current at different stimulus rates for 2 s trains of biphasic pulses applied to the right superior canal on the 1st postsurgical test day. Rows show data from different test subjects. Note that the superior canal was not implanted in subject S2. Columns from left to right display horizontal slow phase velocity vs. current, vertical slow phase velocity vs. current, and a polar plot of 2D eye velocity vs. current. Negative values indicate leftward or downward slow phase velocity. Error bars display ± 1 SD of the slow phase velocity of all slow phases collected over all trials.
Fig. 10.
Fig. 10.
Superimposed traces of average slow phase eye velocity vs. stimulation current for 2 s trains of biphasic pulses applied to the right lateral canal at different time points postsurgery. Rows show data from different test subjects. Columns from left to right display horizontal slow phase velocity vs. current and vertical slow phase velocity vs. current. Negative values indicate leftward or downward slow phase velocity. Error bars display ± 1 SD of the slow phase velocity of all slow phases collected over all trials.
Fig. 11.
Fig. 11.
Superimposed traces of average slow phase eye velocity vs. stimulation current for 2 s trains of biphasic pulses applied to the right posterior canal at different time points postsurgery. Rows show data from different test subjects. Columns from left to right display horizontal slow phase velocity vs. current and vertical slow phase velocity vs. current. Negative values indicate leftward or downward slow phase velocity. Error bars display ± 1 SD of the slow phase velocity of all slow phases collected over all trials.
Fig. 12.
Fig. 12.
Superimposed traces of average slow phase eye velocity vs. stimulation current for 2 s trains of biphasic pulses applied to the right superior canal at different time points postsurgery. Rows show data from different test subjects. Note that the superior canal was not implanted in subject S2. Columns from left to right display horizontal slow phase velocity vs. current and vertical slow phase velocity vs. current. Negative values indicate leftward or downward slow phase velocity. Error bars display ± 1 SD of the slow phase velocity of all slow phases collected over all trials.
Fig. 13.
Fig. 13.
Average slow phase velocity vs. current for monopolar electrical stimulation and for cross canal stimulation in subject S2. A: horizontal average slow phase velocities vs. stimulation current for stimulation of the distal site of the right lateral canal array with a return to either a remote ground and case ground (ECE12 return) or to the distal site of the right posterior canal array (Posterior return). B: vertical average slow phase velocities for stimulation as in A. C: horizontal average slow phase velocities vs. stimulation current for stimulation of the distal site of the right posterior canal array with a return to either a remote ground and case ground or to the distal site of the right lateral canal array (Lateral return). D: vertical average slow phase velocities for stimulation as in C. Negative values indicate leftward or downward slow phase velocity. Error bars display ± 1 SD of the slow phase velocity of all slow phases collected over all trials.
Fig. 14.
Fig. 14.
Verbally reported perceived amplitude of rotation vs. current for 2 s trains of single canal electrical stimulation at different stimulus rates on the 1st test day in all subjects. A, B, D, E: perceived yaw rotation amplitude leftward vs. current for right lateral canal stimulation in subjects S1, S2, S3, and S4. C: perceived pitch rotation amplitude backward vs. current for posterior canal stimulation in subject S2. Inset: perceived yaw rotation and cumulative eye movement amplitude vs. current for 2 s trains of electrical stimulation at 300 pps for 3 subjects.

References

    1. Agrawal Y, Bremova T, Kremmyda O, Strupp M, Macneilage PR. Clinical testing of otolith function: perceptual thresholds and myogenic potentials. J Assoc Res Otolaryngol 14: 905–915, 2013. - PMC - PubMed
    1. Baier B, Thömke F, Wilting J, Heinze C, Geber C, Dieterich M. A pathway in the brainstem for roll-tilt of the subjective visual vertical: evidence from a lesion-behavior mapping study. J Neurosci 32: 14854–14858, 2012. - PMC - PubMed
    1. Baird RA, Desmadryl G, Fernández C, Goldberg JM. The vestibular nerve of the chinchilla. II. Relation between afferent response properties and peripheral innervation patterns in the semicircular canals. J Neurophysiol 60: 182–203, 1988. - PubMed
    1. Barnett-Cowan M, Harris LR. Perceived timing of vestibular stimulation relative to touch, light, and sound. Exp Brain Res 198: 221–231, 2009. - PubMed
    1. Benson AJ, Spencer MB, Stott JR. Thresholds for the detection of the direction of whole- body, linear movement in the horizontal plane. Aviat Space Environ Med 57: 1088–1096, 1986. - PubMed

Publication types

LinkOut - more resources