. 2015 Apr 1;113(7):2605-17.
doi: 10.1152/jn.00480.2014. Epub 2015 Feb 4.

Surround suppression and temporal processing of visual signals

Affiliations

Surround suppression and temporal processing of visual signals

Henry J Alitto et al. J Neurophysiol. .

Abstract

Extraclassical surround suppression strongly modulates responses of neurons in the retina, lateral geniculate nucleus (LGN), and primary visual cortex. Although a great deal is known about the spatial properties of extraclassical suppression and the role it serves in stimulus size tuning, relatively little is known about how extraclassical suppression shapes visual processing in the temporal domain. We recorded the spiking activity of retinal ganglion cells and LGN neurons in the cat to test the hypothesis that extraclassical suppression influences temporal features of visual responses in the early visual system. Our results demonstrate that extraclassical suppression not only shifts the distribution of interspike intervals in a manner that decreases the efficacy of neuronal communication, it also decreases the reliability of neuronal responses to visual stimuli and it decreases the duration of visual responses, an effect that underlies a rightward shift in the temporal frequency tuning of LGN neurons. Taken together, these results reveal a dynamic relationship between extraclassical suppression and the temporal features of neuronal responses.

Keywords: cat; extraclassical suppression; lateral geniculate nucleus; nonlinear receptive field.


Figures

Fig. 1.
Fig. 1.
Contrast gain control in the retina and lateral geniculate nucleus (LGN). A: the response of a hypothetical linear retinal ganglion cell or LGN neuron as a function of stimulus contrast. Gain is constant regardless of the strength of the visual stimulus. C and E: likewise, the temporal frequency (TF) response function (C) and impulse response (E) of a linear LGN neuron simply scale with stimulus contrast. Thus measures like the TF50 and response duration remain constant as contrast changes (black line, high contrast; gray line, low contrast). B: the response gain of many real LGN neurons, however, decreases as stimulus contrast increases, a phenomenon known as contrast gain control. D and F: furthermore, the temporal frequency response function (D) and impulse response (F) of many LGN neurons are significantly transformed as stimulus contrast increases, becoming less sensitive to low frequencies and more sensitive to high frequencies.
Fig. 2.
Fig. 2.
Linear vs. nonlinear surround suppression. A: the classical center/surround receptive field has a circularly symmetrical, spatially antagonistic organization composed of 2 linear subunits: a classical center and a classical surround. B: the difference of Gaussians (DOG) model based on the linear combination of the classical center and surround subunits. C: when the DOG model is assumed, the spatial parameters can be estimated by fitting a spatial frequency (SF) response function to a frequency domain DOG equation (see materials and methods). D: the response function of a hypothetical purely linear LGN neuron when presented with a spot of the preferred luminance polarity that varies in stimulus diameter. E: the response of the same hypothetical neuron to a sinusoidal grating of the preferred spatial frequency (solid black line; note that the decreased slope of the response at point a marks the transition point between the classical center and the classical surround: the point where the strength of the surround subunit equals the strength of the center subunit). In contrast to the hypothetical response, most LGN neurons display a substantial amount of nonlinear, extraclassical suppression that cannot be accounted for by the linear model (dashed gray line). F: the amount of predicted linear suppression to a sinusoidal stimulus depends on how well the spatial properties of the classical receptive field (RF) match the stimulus.
Fig. 3.
Fig. 3.
Size tuning and extraclassical suppression in retinal ganglion cells and LGN neurons. Representative area summation response functions for 2 LGN neurons (A and C) and 2 retinal ganglion cells (B and D). Recordings of retinal ganglion cell activity made from the axons of retinal ganglion cells within the optic track. For each cell, the solid black line shows the DOG fit to measured values (black dots). E and F: histograms showing the distribution of suppression index values (see materials and methods) for the sample of LGN neurons (n = 81) and retinal ganglion cells (n = 28). Dashed lines show the mean suppression index for the sample of LGN neurons and retinal ganglion cells (0.43 ± 0.02 and 0.30 ± 0.02, respectively; P < 0.001). G and H: scatterplots showing the relationship between measured suppression index values and suppression index values estimated for the linear contribution made by the classical surround of receptive fields (see materials and methods). Red “X” indicates mean values.
Fig. 4.
Fig. 4.
Extraclassical suppression is amplified from presynaptic to postsynaptic neurons via stimulus size-dependent effects on the distribution of presynaptic interspike intervals (ISIs) and the relationship between ISI and synaptic efficacy. Compared with optimal-size stimuli, large stimuli shift the distribution of ISIs toward longer values. A and B: the distribution of ISIs for a representative retinal ganglion cell. F and G: the distribution of ISIs for a representative LGN neuron. Black lines show unnormalized (A and F) and normalized (B and G) responses to optimal-size stimuli; gray lines show responses to large stimuli. A and F, insets: the influence of ISI on the efficacy (% presynaptic spikes to evoke postsynaptic spikes) of retinogeniculate and geniculocortical communication (based on Usrey et al. 1998, 2000). At both locations in the visual pathway, efficacy is greatest for spikes following short ISIs. C and H: estimated average efficacy of retinal (C) and LGN (H) spikes evoked with large and optimal-size stimuli. Estimates based on the shift in ISIs with stimulus size and the relationship between ISI and efficacy (see materials and methods). Red “X” indicates mean values. D and I: comparison of area summation response functions across cells calculated from experimentally observed values (“Obs,” solid black lines) and values adjusted to take into account the influence of ISI and spike efficacy (“SE”, dashed black lines) on synaptic communication. After accounting for suppression-dependent changes in spike efficacy, retinal area summation response functions are shifted toward the observed values for the LGN (D; gray line). E and J: using a suppression index to quantify the strength of surround suppression (see materials and methods), the ISI-dependent enhancement of surround suppression from pre- to postsynaptic cells is significant (P < 0.05) for the pathway from retina to LGN (E) and from LGN to primary visual cortex (V1) (J). Red “X” indicates mean values.
Fig. 5.
Fig. 5.
Extraclassical suppression modulates LGN response reliability via changes in firing rate. A: raster plot showing the responses of a representative LGN neuron to repeated presentations of an optimal-size, 5-s clip of an m-sequence-modulated, contrast-reversing grating. The same sequence was also used for a large-size stimulus (data not shown). B: scatterplot showing the relationship between change in Fano factor (variance/mean) as a function of stimulus size and change in spike count. Across the sample of LGN neurons, there was a significant negative correlation (dashed line = linear regression). C: scatterplot showing the relationship between spike count variance and spike count mean for a representative cell stimulated with an optimal-size stimulus (black dots) and a large stimulus (gray dots). Each dot represents the mean and variance for a specific time bin of the 5-s stimulus using 30-ms bins. The values for the 2 stimulus conditions (large stimuli, optimal-size stimuli) were independently fit to power functions (dashed lines). D: across the sample of LGN neurons, surround suppression did not significantly influence the best-fitting power equation (X = mean value).
Fig. 6.
Fig. 6.
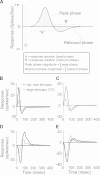
Extraclassical suppression modulates the impulse response of LGN neurons. Impulse responses were calculated from neuronal responses to an m-sequence-modulated, contrast-reversing, sine-wave grating (see materials and methods). A: schematic illustration of a typical impulse response. The biphasic response consists of an initial peak phase followed by a rebound phase. B–E: impulse responses from 4 representative LGN neurons: 2 on-center cells (B and C) and 2 off-center cells (D and E). For each cell, 2 impulse responses are shown, 1 with an optimal-size stimulus (black line) and 1 with a large stimulus that evoked extraclassical suppression (gray line).
Fig. 7.
Fig. 7.
Extraclassical surround suppression decreases the magnitude and duration of LGN impulse responses. Extraclassical surround suppression in the LGN decreases the magnitude (A) and the duration (B) of both the peak (left) and rebound (right) phases of LGN impulse responses. Cross hairs indicate mean values.
Fig. 8.
Fig. 8.
Extraclassical surround suppression modulates temporal frequency tuning in the LGN. The influence of stimulus size on temporal frequency tuning is evident from measurements using contrast-reversing grating stimuli (A–C) and drifting grating stimuli (D–F). A: impulse response functions of a representative LGN neuron excited with an optimal-size stimulus (black line) and a large stimulus (gray line). B and C: temporal frequency response functions derived from the impulse responses of 2 representative LGN neurons (black lines, optimal-size stimuli; gray lines, large stimuli). Temporal frequency response functions were calculated by performing an inverse Fourier transformation on the impulse responses. D–F: temporal frequency response functions of 3 representative LGN neurons calculated directly from their responses to drifting sine-wave grating stimuli (black lines, optimal-size stimuli; gray lines, large stimuli) that varied in temporal frequency.
Fig. 9.
Fig. 9.
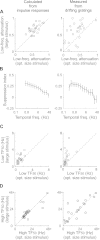
Extraclassical surround suppression shifts LGN temporal frequency response functions toward higher frequencies. A: scatterplots showing the influence of stimulus size on low-frequency attenuation (see materials and methods). Nonlinear suppression was greatest at low temporal frequencies, causing an increase in low-frequency attenuation in the LGN. B: line graphs showing the relationship between stimulus temporal frequency and the strength of suppression (quantified with a suppression index, larger values correspond to greater suppression; see materials and methods) across the sample of LGN neurons. Suppression index values are inversely proportional to stimulus temporal frequency. Vertical lines indicate SE. C and D: the influence of extraclassical surround suppression on shifting temporal frequency response functions toward higher temporal frequencies is also evident in scatterplots showing a significant influence of stimulus size on the lowest (C) and highest (D) temporal frequencies to evoke half-maximum responses (Low TF50 and High TF50, respectively).

References

    1. Adesnik H, Bruns W, Taniguchi H, Huang ZJ, Scanziani M. A neural circuit for spatial summation in visual cortex. Nature 490: 226–231, 2012. - PMC - PubMed
    1. Ahmed B, Hammond P. Response of cat retinal ganglion cells to motion of visual texture. Exp Brain Res 53: 444–450, 1984. - PubMed
    1. Alitto HJ, Moore BD 4th, Rathbun DL, Usrey WM. A comparison of visual responses in the lateral geniculate nucleus of alert and anaesthetized macaque monkeys. J Physiol 589: 87–99, 2011. - PMC - PubMed
    1. Alitto HJ, Usrey WM. Influence of contrast on orientation and temporal frequency tuning in ferret primary visual cortex. J Neurophysiol 91: 2797–2808, 2004. - PubMed
    1. Alitto HJ, Usrey WM. Origin and dynamics of extraclassical suppression in the lateral geniculate nucleus of the macaque monkey. Neuron 57: 135–146, 2008. - PMC - PubMed

Publication types