. 2015 Feb 5;518(7537):68-73.
doi: 10.1038/nature14158.

Transport domain unlocking sets the uptake rate of an aspartate transporter

Affiliations

Transport domain unlocking sets the uptake rate of an aspartate transporter

Nurunisa Akyuz et al. Nature. .

Abstract

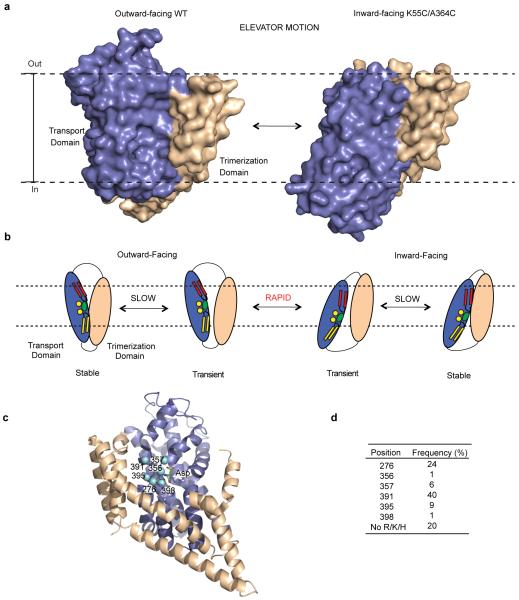
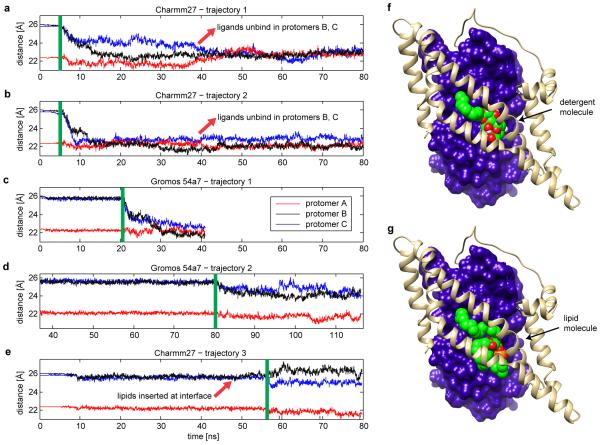
Glutamate transporters terminate neurotransmission by clearing synaptically released glutamate from the extracellular space, allowing repeated rounds of signalling and preventing glutamate-mediated excitotoxicity. Crystallographic studies of a glutamate transporter homologue from the archaeon Pyrococcus horikoshii, GltPh, showed that distinct transport domains translocate substrates into the cytoplasm by moving across the membrane within a central trimerization scaffold. Here we report direct observations of these 'elevator-like' transport domain motions in the context of reconstituted proteoliposomes and physiological ion gradients using single-molecule fluorescence resonance energy transfer (smFRET) imaging. We show that GltPh bearing two mutations introduced to impart characteristics of the human transporter exhibits markedly increased transport domain dynamics, which parallels an increased rate of substrate transport, thereby establishing a direct temporal relationship between transport domain motion and substrate uptake. Crystallographic and computational investigations corroborated these findings by revealing that the 'humanizing' mutations favour structurally 'unlocked' intermediate states in the transport cycle exhibiting increased solvent occupancy at the interface between the transport domain and the trimeric scaffold.


Figures

Extended Data Figure 1
Extended Data Figure 1. Elevator model of transport and spatial conservation of a positively charged residue in glutamate transporter family
a, GltPh protomers in the outward- (left) and inward-facing (right) conformation are shown in surface representation and viewed in membrane plane. Dashed lines represent an approximate position of the membrane hydrocarbon layer. In the inward-facing state, the transport domain (blue) is moved by ~15 Å across the bilayer relative to the trimerization domain (wheat). b, Schematic representation of dynamic mode-switching between stable and transient conformations. c, A single GltPh protomer is shown in cartoon representation. Cyan balls emphasize the amino acid positions at which potentially positively charged residues occur in glutamate transporter homologues. d, Occurrence frequencies of these residues at the marked positions (GltPh numbering). To obtain the frequencies, sequences were harvested from the PFAM database (accession code PF00375). Sequences were parsed to exclude those with over 70 % identity and aligned using Clustal Omega.
Extended Data Figure 2
Extended Data Figure 2. Assignment of FRET efficiency states
a, Shown are the crystal structures of GltPh trimers in symmetrical outward- (OF) and inward- (IF) facing states and a model of an asymmetric configuration with two outward- and one inward-facing protomers,. The structures are shown in surface representation and colored as in Extended Data Figure 1. Black lines connect Cα atoms of residue 378, and the corresponding distances are indicated above the structures. b, Expected FRET efficiency levels for these distances for all possible configurations of subunit pairs: outward/outward (OF/OF), outward/inward (OF/IF), inward/outward (IF/OF) and inward/inward (IF/IF). c, Intramolecularly stabilized 4S(COT)-maleimide Cy3 (n=1) and Cy5 (n=2) fluorophores used in this study synthesized as described previously, with the addition of two sulfonate groups for increased solubility.
Extended Data Figure 3
Extended Data Figure 3. Conformational state distributions of WT and H276,395-GltPh in proteoliposomes
a, Examples of smFRET recordings. Top panels show raw fluorescent signals originating from donor (green) and acceptor (red) dyes. Bottom panels show changes of FRET efficiency calculated from raw data (blue). Red solid lines through the data are idealizations obtained using QuB software b, Contour plots and one-dimensional population histograms in the absence and presence of Na+ and aspartate in the external liposome buffers. Buffer compositions inside and outside of the vesicles are shown above the panels. WT and H276,395-GltPh histograms are fitted to three and two Gaussian functions, respectively. c, Transitions density (TD) plots for the WT (left) and H276,395-GltPh (right) in proteoliposomes in the absence of Na+ and aspartate in the external buffer. d, Means and widths (in brackets) of FRET efficiency distributions derived from Gaussian fits to proteoliposome data in comparison to detergent data.
Extended Data Figure 4
Extended Data Figure 4. Single-molecule dynamics using different liposome-attachment strategies and with higher time-resolution
a-d, Dynamic properties of H276,395-GltPh under transport conditions using a different surface-immobilization strategy and in the presence of electrical potential. a, Surface-immobilization strategy for proteoliposomes using His-tagged lipids. b, Transition frequencies for WT (top) and H276,395-GltPh (bottom) trimers reconstituted into his-tagged liposomes that were site-specifically labeled in just two protomers with intramolecularly photostabilized Cy3 and Cy5 fluorophores. c, A negative inside voltage potential was established in proteoliposomes by adding valinomycin to the uptake buffer. d, Transition frequencies for WT (top) and H276,395-GltPh (bottom) in the presence of valinomycin. Each experiment shown includes statistics based on > 250 individual molecules. The standard error in transition frequency measurements is approximately 0.015 s−1. e-f, Dynamic properties of H276,395-GltPh probed at 15 ms time resolution. Contour plots and one-dimensional population FRET efficiency histograms (e) observed for the humanized mutant in detergent solution in the absence (left) and presence (right) of 100 mM NaCl and 100 µM aspartate. Examples of single-molecule trajectories (f).
Extended Data Figure 5
Extended Data Figure 5. Population changes in response to ligand binding
a-b, TBOA binding to H276,395-GltPh measured in smFRET experiments. Contour plots and population FRET efficiency histograms in the presence of increasing concentrations of TBOA (a). Changes in low- (red) and high- (blue) FRET state populations as a function of TBOA concentration (b). Solid lines through the data correspond to the Hill equation y= ymin+ (ymax-ymin)(xn/(xn+KDn)) with KD=2.4 mM and n=1. The data points shown are averages and standard errors from three independent biological replicates. c, Experimental time domain DEER data (left) and reconstructed distance distributions (right) for H276,395-GltPh (shown in colors) and WT transporter (black) spin-labeled on residue Cys378 in detergent solution. The data were collected in the absence of ligands (top), in the presence of 100 mM Na+ and 350 µM aspartate (middle) and in the presence of 100 mM Na+ and 480 µM TBOA (bottom). The red arrows above the distance distributions mark distances between residues 378 extracted from crystal structures of the symmetric outward- (OF/OF) and inward- (IF/IF) facing states. The data for the WT transporter were adapted from a published study. Notably, the data show that in the apo transporter, outward- and inward-facing states are similarly populated. Binding of Na+ ions and aspartate favors the inward-facing state, while binding of TBOA favors the outward-facing state.
Extended Data Figure 6
Extended Data Figure 6. Aspartate binding experiments
a, FRET efficiency population contour plots determined for H276,395-GltPh in detergent micelles in the presence of 100 µM aspartate and increasing concentrations of Na+ ions (indicated above the panels). b-c, Representative aspartate binding isotherms derived from ITC experiments for the WT GltPh (b) and H276,395-GltPh (c) in the presence of 10 mM Na+ and 100 mM Na+, respectively. Notably, the binding of aspartate to H276,395-GltPh in the presence of 10 mM Na+ is too weak to measure (inset). Binding experiments were performed using small-volume Nano ITC (TA Instruments). Upper panels show raw data. The cell contained 30 μM (WT-GltPh) and 40 μM (H- GltPh) protein buffer containing 20 mM HEPES/Tris, pH 7.4 and 0.1 mM DDM and indicated concentrations of NaCl. The syringe contained Asp at 200 μM concentration in the same buffer; every injection contained 5 μl. Data were processed and analyzed using manufacturer’s software (lower panels). Solid lines through the data are fits to independent binding sites model with the following KD, enthalpy (ΔH), and apparent number of binding sites (n): 380 nM, 15 kcal/mol and 0.65 for the WT transporter, and 285 nM, 16 kcal/mol and 0.68 for H276,395-GltPh.
Extended Data Figure 7
Extended Data Figure 7. Data collection and refinement for Na+ and aspartate bound R276S/M395R-GltPh
a, Table showing data collection and refinement statistics. Scaling and refinement statistics were obtained after anisotropy correction by ellipsoidal truncation using high-resolution cutoffs of 4.9 Å along the a and b axis, and of 4.2 Å along the c axis. b, Stereoview of the 2Fo-Fc electron density map for H276,395-GltPh contoured at 1.5 σ around residue Arg395 in unlocked protomer C. Protein backbone (maroon) is shown in cartoon representations and side chains are shown as lines and colored by atom type. c, Superimposed scaffold domains of the inward-facing WT and H276,395-GltPh are shown in cartoon representation. The labile portions are colored cyan (WT) and magenta (mutant). Helices bend at conserved Pro60 and Pro206 residues (spheres). d, Locked (left) and unlocked (right) mutant protomers viewed from the cytoplasm and shown in surface representation.
Extended Data Figure 8
Extended Data Figure 8. Arg395 adapts to its environment
a, The arginine side chain (Arg276 in the WT; Arg395 in H276,395-GltPh) is seen in MD simulations to engage in hydrogen bonding interactions. Shown is the extent of the hydrogen bonds formation as a function of simulation time in Charmm Trajectory 3 (see Extended Data Figure 10). The main interactions of the arginine in both mutant and WT are with water molecules, but the locations of the waters are very different. In H276,395-GltPh, Arg395 side chain is located 5 to 9 Å below the level of the membrane surface, so that the water molecules are those penetrating the membrane-protein interface due to remodeling the membrane. In the WT, the water molecules interacting with Arg276 are in the space created inside the protein. b, The minimum distance from WT Met395 (top) or mutant Arg395 (bottom) side chains to any lipid phosphate group (left) or any water molecule (right) in Charmm Trajectory 3. In H276,395-GltPh after the initial equilibration phase, lipid phosphate groups interact with Arg395 either directly (5 Å distance) or through water (7.5 Å distance). In the WT, lipid head groups remain far from the hydrophobic Met395 side chain. Water interacts constantly with Arg395, but only occasionally with Met395 (in protomer B, a water molecule approaches M395 from the inside of the protein, at the interface between transport and trimerization domains). c, The same set of distances as in (b) for the mutant, from a different trajectory (G54a7 Trajectory 2) obtained independently, utilizing a different force field. The same trends are observed as in (b), showing proximity to the polar environment. d, Membrane bending (blue indicates thinning, red indicates thickening) close to Arg395 (green) which exposes its side chain to a polar environment comprised of water molecules and lipid head groups. e, RMSD of the Arg395 side chain with respect to the crystal structure after alignment on the trimerization domain, calculated from Charmm Trajectory 3 and G54a7 Trajectory 2. The side chain initially samples different conformations before settling into the membrane-exposed position shown in panel (d).
Extended Data Figure 9
Extended Data Figure 9. Lipids or detergent molecules stabilize the unlocked conformation of H276,395-GltPh
a-e, Center-of-mass distance between the transport and scaffold domains of protomers A, B, and C of H276,395-GltPh as a function of MD simulation time.. The data are from five independent simulations initiated with position restraints on the Cα atoms (later released at different time points) and with the domain interface solvated with water. The vertical green lines indicate the moment in the corresponding trajectory when position restraints were turned off. Panels a and b show two repeats of the same starting structure simulated with the Charmm force field and panel c with Gromos force field. The transport domains in protomers B and C collapse onto the trimerization domain rapidly and loose their ligands in some cases (red arrows). d, A simulation, in which lipid tails partially insert into the interface spontaneously; the unlocked structure is stable much longer (note the different time scales on the time axis), and the collapse is only partial. e, The trajectory of a NAMD simulation (Charmm force field) in which lipid molecules were docked into the interface of protomers B and C at the time marked by the red arrow (3 lipids per protomer). The lipids remained in the docked region for the entire duration of the simulation and stabilized the position of the transport domain. f and g, The best scored docking poses for a detergent molecule and a POPC lipid, respectively, docked at the interface of protomer C.
Extended Data Figure 10
Extended Data Figure 10. Simulated smFRET data recapitulate experimental observations
a-d, Simulated FRET efficiency population contour plots (left side of each panel) and cumulative population histograms (right side) for WT GltPh (a) and H276,395-GltPh (b), and the corresponding transition density plots (c and d), (see Fig. 2 for corresponding experimental data). As noted before, there are fewer transitions observed between the low- and high-FRET states in the WT transporter than would be expected from the model. This may either be because the model does not recapitulate the noise correctly or it may reflect previously uncharacterized communication between the protomers that warrants further investigation. e-f, Dwell time distributions for the low- (left panel) and intermediate- and high-FRET states (right panels) obtained for WT GltPh (e) and H276,395- GltPh (f) (see Fig. 4 for corresponding experimental data).
Figure 1
Figure 1. Transport rates and ‘elevator-like’ domain dynamics are correlated
a, Surface representation of the outward-facing GltPh showing the transport (blue) and scaffold (wheat) domains. In one protomer, HP1 (yellow) and TM8 (dark blue) are emphasized as cartoons. In the enlarged substrate-binding site (right), mutated residues and aspartate are shown as sticks and ions as spheres. b, Sequence alignment for HP1 and TM8 with mutation sites highlighted in pink. c, Aspartate uptake by unlabeled (black) and labeled (red) transporters. Substrate uptake data are shown as averages of at least three experiments with standard deviations. d, Proteoliposome attachment strategy. e, smFRET trajectories recorded for the WT and mutant in proteoliposomes under transport conditions. f, Transition density plots corresponding to e. The average transition frequencies (t/s) and the number of total transitions (Nt) are shown. Color scale is from tan (lowest) to red (highest frequency).
Figure 2
Figure 2. Ligand-dependent state distributions in detergent
In each panel, time-dependent FRET efficiency population contour plots (left) and cumulative population histograms (right) are shown for the WT (a) and mutant (c). Experimental conditions are indicated above the panels. Contour plots are color-coded from tan (lowest) to red (highest population);color scale from 0-12%. Histograms display the time-averaged state distributions. Solid black lines are fits to sums of individual Gaussian functions (red lines). N is the number of molecules analyzed. e, d, Corresponding transition density plots (as in Fig. 1).
Figure 3
Figure 3. Coupled Na+ and aspartate binding to H276,395-GltPh
a, Populations of low- (left) and higher- (right) FRET states determined for H276,395-GltPh in detergent micelles as functions of Na+ concentration in the presence of 0 (blue), 20 (black) and 100 (red) µM aspartate. Solid lines are fits to Hill equation with KD=200, 30 and 15 mM, respectively, and n value of 3. The data points shown are averages and standard errors from three independent biological replicates. b, Logarithmic plots of aspartate KD-s as functions of Na+ concentrations. Data are from ITC (black) and smFRET (gray). The solid line through the data is a linear fit with slope 3.2. The extent of coupling between Na+ and aspartate binding is similar to WT (dashed line).
Figure 4
Figure 4. Monodisperse dynamic behavior of H276,395-GltPh
Dwell time distributions (a, c) and average dwell times (b, d) for the low- (L, solid lines) and intermediate- and high-FRET states (I+H, dashed lines) obtained for the WT (a, b) and H276,395-GltPh (c, d) in detergent. The distributions for apo (blue) and Na+/aspartate-bound proteins (red) were fitted to a probability density function. The fitted time constants are in Extended Data Table 1c. Average dwells are plotted as functions of Na+ concentration in the presence of 10 and 100 µM aspartate for WT and H276,395-GltPh, respectively. Solid lines are fits to Hill equation with KD=15 mM and n= 3.2 for WT and KD= 19 mM and n=3.2 for H276,395-GltPh. The data points shown are averages and standard errors from three independent biological replicates.
Figure 5
Figure 5. Crystal structure of the H276,395-GltPh
a, Single protomers of inward-facing WT (left), locked mutant (center) and unlocked mutant (right) in surface representation, colored as in Fig. 1,;HP2 is red. Residues 276 and 395 are colored by atom type. The approximate limits of the hydrocarbon layer of the membrane are shown as dashed lines. b, Substrate binding sites (enlarged) viewed from the cytoplasm. HP1 and HP2 are in cartoon representation; aspartate (black) and residues 276, 395 and Asp394 (colored by atom type) are emphasized as spheres. Arrowhead (cyan) marks the region of increased solvent accessibility. e, Cytoplasmic view of the unlocked protomer showing the crevice at the domain interface. Dashed line replaces TM2-TM3 loop for clarity. Arrows indicate regions of increased water and lipid accessibility. Open conformations of HP2 were modeled based on the TBOA-bound (green) structure of GltPh.
Figure 6
Figure 6. Kinetic model of transport
a, Schematic representation of the transport cycle. Red and blue boxes indicate dynamic and quiescent periods, respectively. b, Simulated single-molecule trajectories for WT GltPh (top) and H276,395-GltPh (bottom). Periods of long-lived ‘locked’ states are shaded blue; periods of transitions between ‘unlocked’ states are shaded red. c, Structures of the inward-facing WT ‘locked’ state (top) and H276,395-GltPh ‘unlocked’ state (bottom).

References

    1. Zerangue N, Kavanaugh MP. Flux coupling in a neuronal glutamate transporter. Nature. 1996;383:634–7. - PubMed
    1. Yernool D, Boudker O, Jin Y, Gouaux E. Structure of a glutamate transporter homologue from Pyrococcus horikoshii. Nature. 2004;431:811–8. - PubMed
    1. Boudker O, Ryan RM, Yernool D, Shimamoto K, Gouaux E. Coupling substrate and ion binding to extracellular gate of a sodium-dependent aspartate transporter. Nature. 2007;445:387–93. - PubMed
    1. Reyes N, Ginter C, Boudker O. Transport mechanism of a bacterial homologue of glutamate transporters. Nature. 2009;462:880–5. - PMC - PubMed
    1. Verdon G, Boudker O. Crystal structure of an asymmetric trimer of a bacterial glutamate transporter homolog. Nat Struct Mol Biol. 2012;19:355–7. - PMC - PubMed

Publication types

MeSH terms

Associated data