. 2015 Feb 5:6:6219.
doi: 10.1038/ncomms7219.

Imaging regulatory T cell dynamics and CTLA4-mediated suppression of T cell priming

Affiliations

Imaging regulatory T cell dynamics and CTLA4-mediated suppression of T cell priming

Melanie P Matheu et al. Nat Commun. .

Abstract

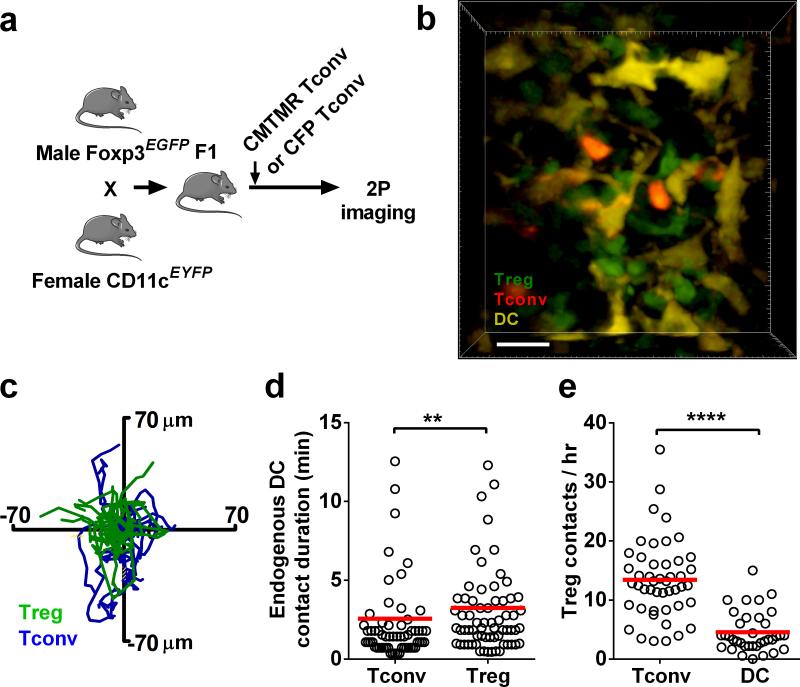
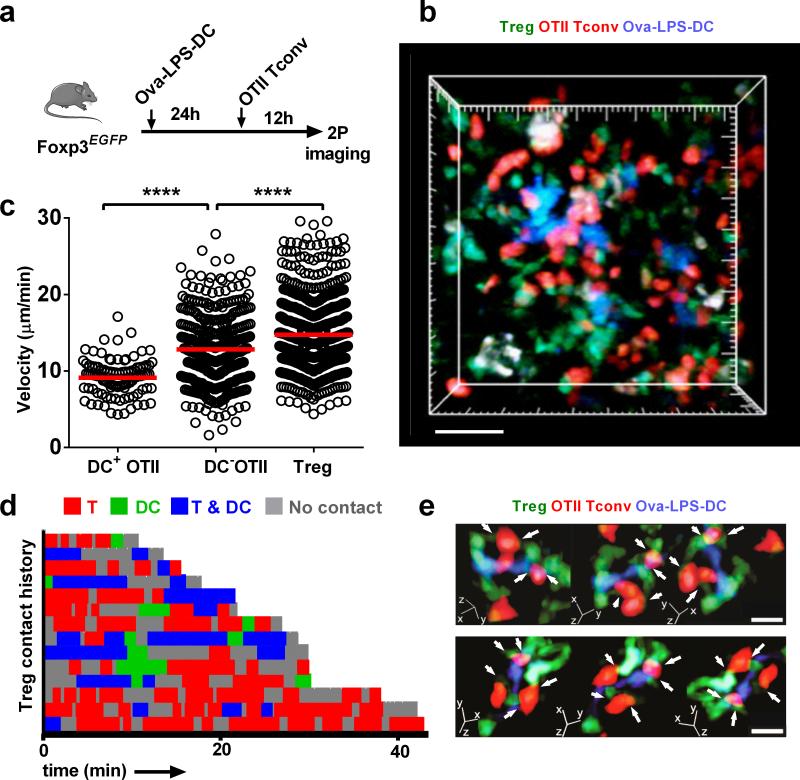
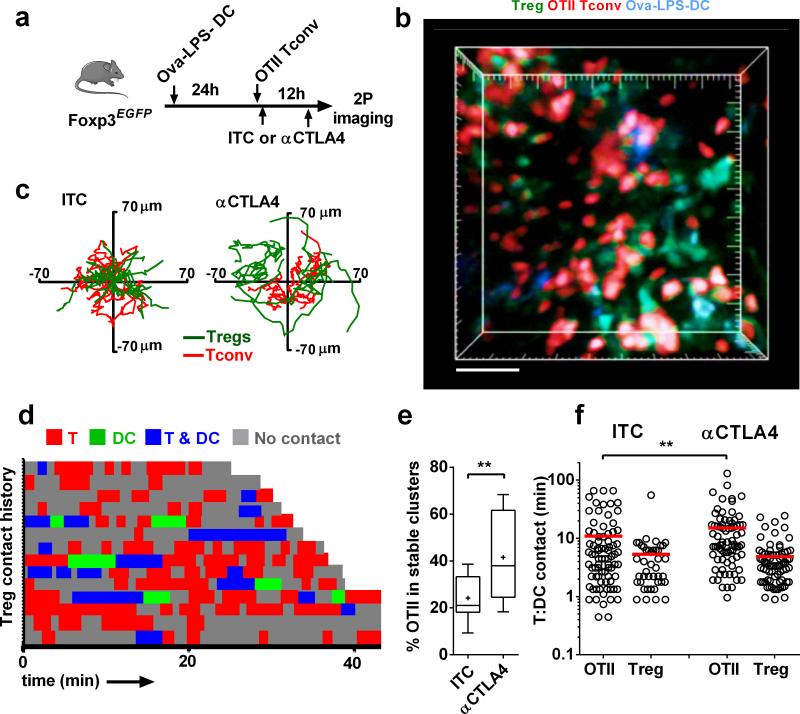
Foxp3(+) regulatory T cells (Tregs) maintain immune homoeostasis through mechanisms that remain incompletely defined. Here by two-photon (2P) imaging, we examine the cellular dynamics of endogenous Tregs. Tregs are identified as two non-overlapping populations in the T-zone and follicular regions of the lymph node (LN). In the T-zone, Tregs migrate more rapidly than conventional T cells (Tconv), extend longer processes and interact with resident dendritic cells (DC) and Tconv. Tregs intercept immigrant DCs and interact with antigen-induced DC:Tconv clusters, while continuing to form contacts with activated Tconv. During antigen-specific responses, blocking CTLA4-B7 interactions reduces Treg-Tconv interaction times, increases the volume of DC:Tconv clusters and enhances subsequent Tconv proliferation in vivo. Our results demonstrate a role for altered cellular choreography of Tregs through CTLA4-based interactions to limit T-cell priming.


Figures

Figure 1
Figure 1
Endogenous Foxp3+ Treg regional behavior and interaction with Tconvs. (a) Tregs in inguinal lymph node from a Foxp3EGFP mouse under steady-state conditions. Green, EGFP+ endogenous Tregs; blue, second-harmonic collagen signal in capsular boundary. Single plane image, scale bar = 100 μm. White square represents area imaged in (c). See Supplementary Video 2. (b) T-zone and follicular Tregs (both green), visualized 72 hr after adoptive transfer of CFP+CD19+ B cells (blue) and CMTMR-labeled Tconv cells (red). Note Tregs colocalized with B cells within the dotted outline, and at higher density with Tconv cells throughout the T cell zone. Scale bar = 50 μm. (c) Non-overlapping populations of Tregs in the T-zone and the follicle. Treg movements represented by tracks within (light blue tracks) and outside the B cell follicle (bright green). Cells tracked over 29:38 (min:sec); 35 μm z stack, 50 μm tick marks. (d) Treg velocities in three regions of the lymph node. Each circle represents mean velocity in the T cell zone (n = 174 tracks); in the follicle (n = 397 tracks); and within 50 μm of the capsule (n = 343 tracks). Data pooled from 4 experiments. Open circles represent measurements from individual cell tracks; red bars indicate overall mean values; and p values are marked as * p < 0.05, ** p < 0.01, *** p < 0.001, and **** p < 0.0001 Mann–Whitney U test. (e) CMTMR-labeled Tconv cells adoptively transferred 24 hr before imaging and tracked with Tregs over 12 min. Still image (top left, scale bar = 30 μm) and corresponding tracks (top right) of Tconv cells (red) and Tregs (green) in the T-zone. Lower panels: magnified views of representative individual Tconv cells and endogenous Tregs (scale bars = 20 μm). Asterisks mark cellular processes. See Supplementary Video 4. (f) Velocities of individual Tregs (n = 217 tracks) and Tconvs (n = 166 tracks) in the T-zone. Data pooled from 3 experiments. (g) Tconvs (red) and Tregs (green) in the absence of antigen; right panel pseudocolored to highlight areas of contact; scale bars = 10 μm.
Figure 2
Figure 2
Tregs interact with LN-resident DCs. (a) Experimental design to visualize endogenous Tregs together with resident DCs and Tconv cells. CMTMR-labeled Tconv cells from wild type C57Bl/6 mice, or CFP+ Tconv cells from β-actin-CFP mice were adoptively transferred 12 hr or 4 days, respectively, prior to imaging, into F1 of Foxp3EGFP x CD11cEYFP mice. (b) Interactions among Tconv cells (red), resident DCs (yellow), and Tregs (green) under steady-state conditions. Scale bar = 20 μm, see Supplementary Video 5. (c) Superimposed Treg (green) and Tconv (blue) tracks, z compressed and normalized to DC position at center (x, y, = 0, 0). Data from CFP+ Tconv cells are shown; similar results were obtained with CMTMR-labeled Tconv cells. Cells were tracked over 15:21 (min:sec). (d) Contact durations between cell pairs: Tconvs interacting with DCs (n = 61); Tregs interacting with DCs (n = 67). Data from CFP+ Tconv cells are shown, and are also representative of results with CMTMR-labeled Tconv cells. 3 separate experiments, imaging duration >1 hr. (e) Observed contact frequencies with endogenous Tregs by labeled Tconvs (n = 47) and by resident DCs (n = 36). 2 experiments.
Figure 3
Figure 3
Tregs engage immigrant DCs near the lymph node capsule. (a) LPS-activated CMTMR-labeled DCs (red) imaged in the draining inguinal lymph node 24 hr after subcutaneous injection into a Foxp3EGFP mouse, showing immigrant DCs encountering and making contact with numerous endogenous Tregs (green) directly beneath the collagen capsule (blue) of the lymph node (major tick marks = 20 μm, 50 μm z-stack). See Supplementary Video 6. (b) Close-up image of a DC (red) near the collagen capsule and its interactions with several Tregs (green). Major tick marks = 10 μm. (c) Space-filled rendering of the DC (red) from (b) and an associated Treg (green) with track (grey, 39:27 min:sec duration of imaging), showing the close association between Treg and DC (scale bar = 5 μm). (d) Time sequence (times shown in min:s) showing interactions of Tregs (green with grey tracks) engaging recently immigrated DCs (red). (e) Experimental design to examine the effect of LPS-activated DCs on OTII Tconv cells and Tregs. LPS-activated DCs from a ECFP mouse were injected into a Foxp3EGFP mouse followed by adoptive transfer of CMTMR-labeled OTII Tconv cells at 24 hr and 2P imaging in the draining lymph node 12 hr later. (f) Snapshot showing adoptively transferred OTII Tconv cells (red), LPS activated DC (blue), and Tregs (green). Scale bar = 30 μm. See Supplementary Video 7. (g) Contact durations of Tregs with LPS-DCs (n = 110 contacts) and Tconvs with LPS-DCs (88 contacts). Data pooled from 3 experiments each. (h) Effect of LPS-activated DCs on Treg velocities. Control velocities in the absence of LPS-DCs: Treg n = 296; OTII Tconv cells n = 213. In the presence of LPS DCs: OTII Tconv cell velocity did not change appreciably (p = 0.7, n = 207, Mann–Whitney U test) whereas Treg velocity was reduced (n = 193) Data pooled from 3 experiments each.
Figure 4
Figure 4
Dynamics of Tregs during antigen-specific Tconv priming. (a) Experimental design to examine endogenous Treg behavior during an immune response. Ova-pulsed DCs were adoptively transferred into Foxp3EGFP mice 24 hr prior to transfer of CMTMR-labeled OTII Tconv cells; imaging was performed 12 hr after OTII T cell transfer. (b) Tconv-DC clusters. Still image showing DCs (blue), OTII Tconv cells (red), and Tregs (green). Scale bar = 50 μm, see Supplementary Video 8. (c) Tconv and Treg velocities. Mean track velocities of OTII T cells were separated into those that interacted with a DC (DC+ OTII, n = 99) and those that did not (DC OTII, n = 426). Treg velocities, n = 811. Data are pooled from 3 experiments. (d) Contact history map for 14 representative Tregs. Each horizontal bar represents times when a single Treg was alone (grey), in contact with a Tconv (red), in contact with a DC (blue), or in contact with DC:Tconv pairs (green). (e) Close-up images of Treg-Tconv cell contacts (white arrows) in the vicinity of a DC. The panel shows 3-way rotations at two time points, 67 sec apart. Scale bar = 10 μm.
Figure 5
Figure 5
Tregs engage antigen-specific clusters of DCs and Tconv cells in a CTLA4-dependent manner. (a) Experimental design to image the role of CTLA4-B7 in Treg interactions. Ova-pulsed DCs from ECFP mice were adoptively transferred into Foxp3EGFP mice 24 hr prior to CMTMR-labeled OTII Tconv cells; imaging was performed 12 hr after OTII Tconv cell transfer. Animals received 150 μg of either ITC or αCTLA4, 30 min after adoptive transfer and 4 hr prior to imaging. (b) Still image showing DCs (blue), OTII Tconv cells (red), and Tregs (green) in a node from αCTLA4-treated mouse. Scale bar = 50 μm, see Supplementary Video 9. (c) Superimposed tracks of OTII T cells (red) and Tregs (green), with their origins normalized to the center of a DC. Cells were tracked for 10:14 min:sec. n = 21 for ITC and 34 for αCTLA4. (d) Treg contact history map. Each horizontal bar represents a single Treg, with contacts color coded as in Fig. 4d. Note the shorter red and blue bars as compared to Fig. 4d, indicating that Tregs spend less time interacting with Tconv cells and DCs in the presence of αCTLA4. (e) The percentage of OTII T cells in stable contact with a DC was increased by αCTLA4 treatment, compared to control (n = 21 and 14, respectively). 20 min imaging period minimum. (f) Tconv and Treg contact durations with antigen-bearing DCs. OTII Tconv:DC contact durations are increased in the presence of αCTLA4 (n = 78) relative to ITC control (n = 80). Treg:DC contact durations were shortened in the presence of αCTLA4 (n = 42) relative to ITC (n = 83).
Figure 6
Figure 6
CTLA4 is critical for Tconv-Treg interactions during priming. (a) CFSE dilution in OT-II Tconv cells 72 hr following transfer into WT mice primed with Ova-LPS pulsed DCs. Green and red lines for draining lymph node (DLN) of ITC- and αCTLA4-treated mice, respectively; grey line for contralateral LN with αCTLA4. (b) In vivo proliferation of OTII Tconv determined by CFSE dilution; data from 4-5 mice with αCTLA4 or ITC control treatment. (c) In vitro proliferation of Tconv (WT, left, and B7-KO, right) after stimulation with anti-CD3/28 Dynabeads with (blue) and without (red) WT Treg co-culture (1:1 ratio). (d) Inhibition of WT and B7-KO Tconv cell proliferation by WT Tregs; red bars indicate mean values, data pooled from two independent experiments. (e) Left: Ova-pulsed DCs (blue) interacting with OTII Tconvs (red) and Tregs (green) in a Foxp3EGFP mouse. Right: tracks of Tconvs and Tregs that touched a DC at least once during imaging (20:55, min:sec); tracks normalized to DC position; scale bar = 10 μm. (f) Left: Ova-pulsed DCs (blue), OTII Tconvs (red), and Tregs (green) in Foxp3EGFP mouse treated with αCTLA4. Right: tracks of Tconvs and Tregs that interacted with a DC (blue) at least once during imaging (20:33, min:sec). Scale bar = 10 μm. (g) Contact durations of OTII Tconvs in the absence and presence of LPS-DCs. Basal: Tconv:Tconv, n = 135; Tconv:Treg, n = 234. LPS-DCs present: Tconv:Tconv, n = 108; Tconv:Treg, n = 145. (h) Contact durations of OTII Tconvs in the presence of Ova-pulsed DCs after treatment with 150 μg isotype control (ITC) or αCTLA4 antibodies. ITC-treated: Tconv:Tconv, n = 101; Tconv:Treg, n = 108. αCTLA4-treated: Tconv:Tconv, n = 87; Tconv:Treg, n = 152. (i) Velocities of OTII Tconvs and Tregs under basal conditions after treatment with ITC or αCTLA4 antibodies. Tconv tracks: n = 268 (ITC) and 238 (αCTLA4); Treg tracks: n = 296 (ITC) and 213 (αCTLA4). (j) Velocities of OTII Tconvs and Tregs in Ova-LPS-DC immunized mice after treatment with ITC or αCTLA4 antibodies. Tconv tracks: n = 99 (ITC) and 114 (αCTLA4). Treg tracks: n = 811 (ITC) and 305 (αCTLA4).
Figure 7
Figure 7
Summary of Treg, Tconv, and DC dynamics. (a) Cellular choreography illustrating cell dynamics and the role of CTLA using cell shapes rendered from 2P images (Tregs, green; Tconv, red; DCs, blue). Panels represent steady-state conditions (top left); inflammation (LPS DC; top right); T cell priming in three phases (middle); Tregs interacting with clusters during phase II under normal priming conditions (labeled ITC for isotype control; bottom left) and in the presence of CTLA4-blocking antibody (labeled αCTLA4; bottom right). (b) Chart of relative surface expression by Tconv cells during T cell priming. CD4 density refers to the local concentration of antigen-specific T cells near antigen-presenting DCs during phase 2. (c) Color-coded diagram of measured contact durations among Tregs and Tconvs (top panel), and among T cells and DCs (bottom panel). Each change in contact duration (different colors) represents a significant difference of at least p < 0.05.

References

    1. Sakaguchi S, Yamaguchi T, Nomura T, Ono M. Regulatory T cells and immune tolerance. Cell. 2008;133:775–787. - PubMed
    1. van der Vliet HJ, Nieuwenhuis EE. IPEX as a result of mutations in FOXP3. Clin Dev Immunol. 2007;2007:89017. - PMC - PubMed
    1. Wildin RS, Freitas A. IPEX and FOXP3: clinical and research perspectives. J Autoimmun. 2005;25(Suppl):56–62. - PubMed
    1. Huter EN, et al. TGF-beta-induced Foxp3+ regulatory T cells rescue scurfy mice. Eur J Immunol. 2008;38:1814–1821. - PMC - PubMed
    1. Wing K, et al. CTLA-4 control over Foxp3+ regulatory T cell function. Science. 2008;322:271–275. - PubMed

Publication types

MeSH terms