. 2015 Feb 5:6:6220.
doi: 10.1038/ncomms7220.

Quantitative high throughput screening using a primary human three-dimensional organotypic culture predicts in vivo efficacy

Affiliations

Quantitative high throughput screening using a primary human three-dimensional organotypic culture predicts in vivo efficacy

Hilary A Kenny et al. Nat Commun. .

Erratum in

Abstract

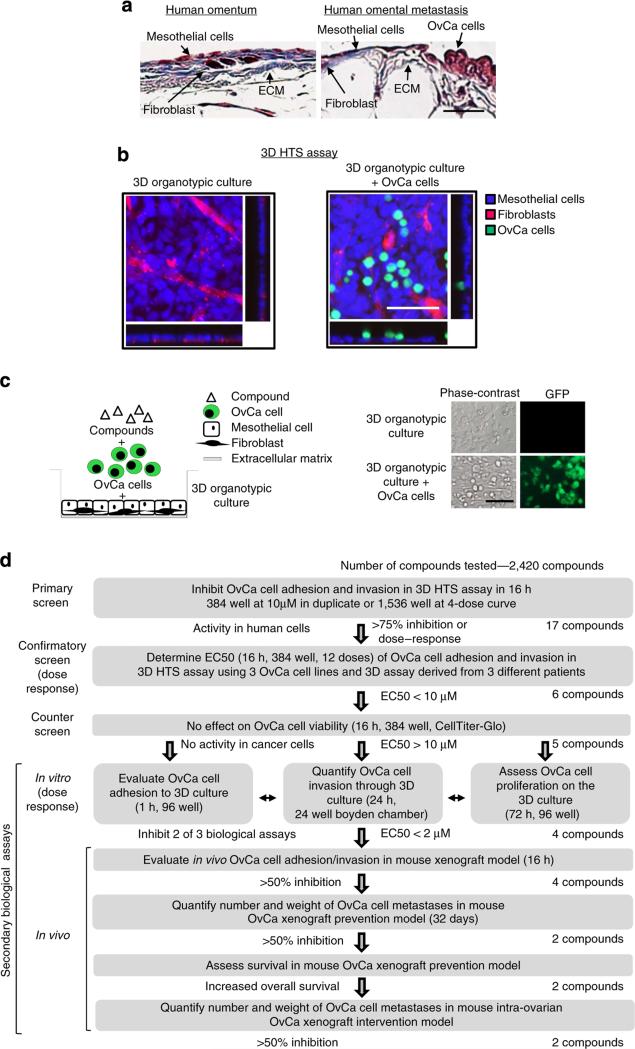
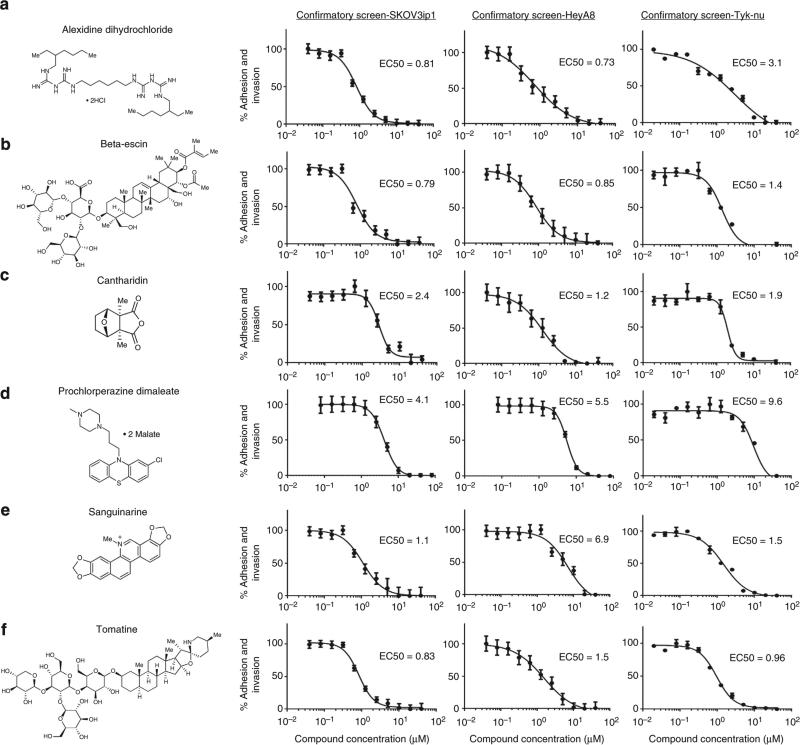
The tumour microenvironment contributes to cancer metastasis and drug resistance. However, most high throughput screening (HTS) assays for drug discovery use cancer cells grown in monolayers. Here we show that a multilayered culture containing primary human fibroblasts, mesothelial cells and extracellular matrix can be adapted into a reliable 384- and 1,536-multi-well HTS assay that reproduces the human ovarian cancer (OvCa) metastatic microenvironment. We validate the identified inhibitors in secondary in vitro and in vivo biological assays using three OvCa cell lines: HeyA8, SKOV3ip1 and Tyk-nu. The active compounds directly inhibit at least two of the three OvCa functions: adhesion, invasion and growth. In vivo, these compounds prevent OvCa adhesion, invasion and metastasis, and improve survival in mouse models. Collectively, these data indicate that a complex three-dimensional culture of the tumour microenvironment can be adapted for quantitative HTS and may improve the disease relevance of assays used for drug screening.


Figures

Figure 1
Figure 1. Optimization of a 3D organotypic HTS assay designed to identify inhibitors of ovarian cancer adhesion and invasion
(a) Haematoxylin and eosin stained images of human omentum (left panel) and omental metastases (right panel; size bar, 50 μm). (b) Fluorescent images of the 3D HTS assay with fluorescently labelled mesothelial cells (blue, CMAC) and fibroblasts (red, CMPTX) with (right panel) and without SKOV3ip1 OvCa cells (green, CMFDA; left panel). Size bar, 100 μm. z-axis (45 μm) reconstruction of optical sections with orthogonal view of maximum intensity shown. (c) Schematic, phase and fluorescent images of the 3D organotypic HTS assay with and without fluorescently labelled (GFP) SKOV3ip1 OvCa cells in a 384-well plate (size bar, 100 μm). (d) Flow chart for 3D HTS screening platform including the primary, confirmatory, counter and secondary biological assays (in vitro and in vivo). The criteria for compound selection and the number of compounds at each step are listed.
Figure 2
Figure 2. The primary 3D organotypic HTS in 384-well and 1,536-well formats
(a) HTS assay (384 well). The Prestwick Chemical Library of compounds at a final concentration of 10 μM (n = 2 experiments, 1,140 compounds) was added to the 384-well 3D HTS assay. Adhesion and invasion of SKOV3ip1–GFP cells after 16 h was evaluated using a fluorescence cytometer. Left, reproducibility plot of primary screen. Right, active compounds were defined as >75% inhibition of OvCa adhesion and invasion (below red line, 15 compounds total, 1% hit rate). (b) 1,536-well HTS assay (four dose responses; 46, 9.2, 1.8 and 0.36 μM). Adhesion and invasion of SKOV3ip1–GFP cells after 16 h was evaluated using a fluorescence cytometer. The 46- and 9.2-μM compound concentraion assay plates are shown. Active compounds were selected using a combination of parameters including curve response, class scoring, maximum response, efficacy and EC50 values (red circles, two compounds total, and 0.2% hit rate). The controls, DMSO (green box) and tomatine (red box) are shown. Pos., positive.
Figure 3
Figure 3. Dose-dependent confirmation of active compounds
Adhesion and invasion of fluorescently labelled (GFP) SKOV3ip1, HeyA8 and Tyk-nu OvCa cells in the 3D culture (HTS assay) was measured over 16 h in a 384-well assay using a 12 dose curve for (a) alexidine dihydrochloride, (b) beta-escin, (c) cantharidin, (d) prochlorperazine dimaleate, (e) sanguinarine and (f) tomatine. Each curve represents the percentage of OvCa–GFP cells that invaded and adhered to the 3D culture. Data points represent mean±s.e.m.
Figure 4
Figure 4. In vitro validation of active compounds
Secondary in vitro biological assays using fluorescently labelled (GFP) SKOV3ip1, HeyA8 and Tyk-nu OvCa cells. Each compound was tested at 1, 5 and 10 μM concentrations or an equal volume of DMSO at each dose. (a) Adhesion assay. The adhesion of OvCa–GFP cells to the 3D culture (n = 5, 96 well) was measured using a fluorescent plate reader. (b) Invasion assay. The invasion of OvCa–GFP cells through the 3D culture plated on a 24-well transwell (n = 5) was analyzed by fluorescent microscopy. (c) Cell growth assay. The growth of OvCa–GFP cells on the 3D culture after 72 h (n = 5, 96 well) was detected using a fluorescent plate reader. Bars represent mean±s.e.m. Significant changes were determined by two-sided unpaired t-tests. *P < 0.05, **P < 0.001.
Figure 5
Figure 5. In vivo validation of active compounds
Secondary in vivo biological assays using fluorescently labelled (GFP) SKOV3ip1 and HeyA8 OvCa cells. (a) In vivo adhesion and invasion assay. Four million OvCa–GFP cells were injected i.p., and 16 h later the omentum was collected. Bound OvCa cells were digested from the omentum and total fluorescence was quantified using a fluorescent plate reader (n = 5). (b) In vivo prevention study. One million SKOV3ip1 cells were injected i.p. with compounds or DMSO (5 μM), and i.p. treatment continued at 48 and 96 h post-cancer cell injection (10 mg kg–1, n = 5). Tumours were collected 32 days post-cancer cell injection and weighed. Significant changes were determined by two-sided unpaired t-tests. *P < 0.05, **P < 0.001. (c) In vivo survival study. One million OvCa cells were injected i.p. with beta-escin, tomatine or DMSO (5 μM), and i.p. treatment continued at 48 and 96 h post-cancer cell injection (10 mg kg–1 or equal volume of DMSO, n = 5). Mice were killed once they showed signs of distress, and Kaplan–Meier curves were calculated. (d) In vivo intra-ovarian intervention study. Twenty-five thousand OvCa cells were injected intra-ovarian; 7 days post-injection treatment started with beta-escin, tomatine (1 mg kg–1, n = 10) or DMSO (volume control) and i.p. treatment continued three times a week for 2 weeks.

References

    1. Quail DF, Joyce JA. Microenvironmental regulation of tumor progression and metastasis. Nat. Med. 2013;19:1423–1437. - PMC - PubMed
    1. Correia AL, Bissell MJ. The tumor microenvironment is a dominant force in multidrug resistance. Drug. Resist. Updat. 2012;15:39–49. - PMC - PubMed
    1. Hanahan D, Coussens LM. Accessories to the crime: functions of cell recruited to the tumor microenvironment. Cancer Cell. 2012;21:309–322. - PubMed
    1. Nieman KM, Romero IL, Van Houten B, Lengyel E. Adipocyte tissue and adipocytes support tumorigenesis and metastasis. Biochim. Biophys. Acta. 2013;1831:1533–1541. - PMC - PubMed
    1. Zang R, Ding L, Tang IC, Wang J, Yang ST. Cell-based assays in high-throughput screening for drug discovery. Int. J. Biotechnol. Wellness Ind. 2012;1:31–51.

Publication types

MeSH terms