. 2015 May 15;593(10):2343-63.
doi: 10.1113/jphysiol.2014.288134. Epub 2015 Mar 17.

Dynamic synchronization of ongoing neuronal activity across spinal segments regulates sensory information flow

Affiliations

Dynamic synchronization of ongoing neuronal activity across spinal segments regulates sensory information flow

E Contreras-Hernández et al. J Physiol. .

Abstract

Previous studies on the correlation between spontaneous cord dorsum potentials recorded in the lumbar spinal segments of anaesthetized cats suggested the operation of a population of dorsal horn neurones that modulates, in a differential manner, transmission along pathways mediating Ib non-reciprocal postsynaptic inhibition and pathways mediating primary afferent depolarization and presynaptic inhibition. In order to gain further insight into the possible neuronal mechanisms that underlie this process, we have measured changes in the correlation between the spontaneous activity of individual dorsal horn neurones and the cord dorsum potentials associated with intermittent activation of these inhibitory pathways. We found that high levels of neuronal synchronization within the dorsal horn are associated with states of incremented activity along the pathways mediating presynaptic inhibition relative to pathways mediating Ib postsynaptic inhibition. It is suggested that ongoing changes in the patterns of functional connectivity within a distributed ensemble of dorsal horn neurones play a relevant role in the state-dependent modulation of impulse transmission along inhibitory pathways, among them those involved in the central control of sensory information. This feature would allow the same neuronal network to be involved in different functional tasks.


Figures

Figure 1
Figure 1
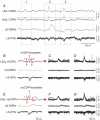
Dot-template selection of spontaneous negative cord dorsum potentials (nCDPs) and negative–positive cord dorsum potentials (npCDPs) A, spontaneous cord dorsum potentials (CDPs) recorded from the rostral and caudal regions of the left L6 segment (L6rL-CDPs and L6cL-CDPs), together with the L6 dorsal root potentials (DRPs) and the L6 intraspinal field potentials (IFPs). The L6cL-CDPs exceeding a preset amplitude (shown by dotted horizontal line) were selected for further processing, together with the associated CDPs, DRPs and IFPs (see boxes 1–3). B, upper trace shows a spontaneous L6cL-nCDP together with the selecting dot-templates. Arrows indicate the dot-template boundaries. C and D, superimposed traces of selected L6cL-nCDPs and associated DRPs and IFPs. EG, same as B–D but with dot-templates adjusted to select L6cL-npCDPs. Note that negative DRPs appeared together with the L6cL-npCDPs but not with L6cL-nCDPs. Intraspinal field potentials were recorded from the left L6 segment at 1532 μm depth (around Rexed's lamina V). Negativity is upward for CDPs and DRPs and downward for IFPs. For further details, see main text.
Figure 2
Figure 2
Neurone showing increased firing during spontaneous nCDPs and npCDPs A, superimposed L5cL spontaneous nCDPs selected with the dot-templates (top traces) together with a single nCDP and associated IFP with spike. Superimposed traces on the left show spikes selected with principal component analysis. B and C, L5cL-nCDPs separated into four groups of different amplitudes and rasters of the associated neuronal action potentials (see colours). D, histograms obtained from the raster display shown in C. EH, same as AD, for L5cL-npCDPs. IK, neuronal responses produced by electrical stimulation of the superficial peroneal (SP) nerve with single pulses 1.4 times threshold (T) applied once per second. The mean onset latency of neuronal responses was 2.7 ± 1.2 ms. The neurone was located between Rexed's laminae V and VI (red dot in Fig. 8Ba). Means of superimposed traces in A, E and I are shown in white. Further explanations are given in the main text.
Figure 3
Figure 3
Neurone showing increased firing during spontaneous nCDPs but not during npCDPs Same format as in Fig. 2. A, superimposed spontaneous L6rL-nCDPs together with a single nCDP and associated IFP. B, superimposed traces of L6rL-nCDPs of different amplitudes (see colours). C, rasters of action potentials associated with L6rL-nCDPs of different amplitudes, as indicated. D, histograms obtained from the raster display shown in C. EH, same as AD, for L6rL-npCDPs. Note the increased neuronal activity during the spontaneous nCDPs but not during the npCDPs. IK, responses produced by SP nerve stimulation with single pulses of 1.5T. Evoked neuronal responses had a mean onset latency of 2.5 ± 1.3 ms. The neurone was located in lamina V (red dot in Fig. 8Ca). Further explanations are given in the main text.
Figure 4
Figure 4
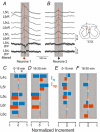
Changes in spontaneous activity of dorsal horn neurones associated with the nCDPs and npCDPs generated in different spinal segments Data obtained from two neurones whose activity was simultaneously recorded with the same micropipette. A and B show samples of spontaneous npCDPs and nCDPs recorded from different segments, displayed together with the raw and filtered L6rL-IFPs, keeping neuronal action potentials (diagram on the right shows recording site). Arrows indicate the action potentials of neurone 1 (red) and neurone 2 (black). C, normalized increments (In and Inp) of activity of neurone 1 during spontaneous nCDPs (blue bars) and npCDPs (red bars) generated in different segments in the left (L) and right side (R) of the spinal cord during a first 15 min recording period. D, same during a second recording period of 15 min. E and F, as C and D but for neurone 2. Further explanations are given in the main text.
Figure 5
Figure 5
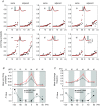
Changes in joint firing probabilities (JFPs) of dorsal horn neurones during spontaneous nCDPs and npCDPs A, JFP index of pairs of neurones calculated at different time intervals (t1–t6) during the spontaneous nCDPs and npCDPs recorded in the same segment as that of the neurone location (left L5 or L6) and in the adjacent segment. The npCDPs-JFPs are plotted in increasing order (red dots) together with the corresponding nCDPs-JFPs (black dots). The insets show mean L6rL-nCDPs (black) and -npCDPs (red) recorded in one experiment together with superimposed grey bars indicating the time windows for JFP calculations. Note that at t3 and t4 most JFPs were higher during the npCDPs than during the nCDPs, regardless of their segmental location relative to neuronal recording segment (same or adjacent). B, mean JFPs and standard error (SE) obtained at different times during the nCDPs (black) and the npCDPs (red). Data obtained from the same and from adjacent segments are combined. C, mean discharge rates and SE of neuronal firing during the nCDPs and npCDPs. Bottom graphs in B and C show the P values calculated with Student's paired t test (black squares) and with the Wilcoxon test (grey circles). Further explanations are given in the main text.
Figure 6
Figure 6
Changes in cross-correlation (CC) between the action potentials of pairs of neurones during nCDPs and npCDPs AC, a pair of recording micropipettes were inserted within the dorsal horn in the L5cL segment; one recorded the action potentials of neurone n1 and the other the action potentials of neurones n2 and n3. A and B, CCs of the activity of neurones n1 and n2 during the L5cL nCDPs and npCDPs. C and D, same for neurones n1 and n3. Note the higher neuronal synchronization during the npCDPs than during the nCDPs. E and F, CCs of neurones nA and nB recorded in a different experiment with two separate micropipettes, both inserted in segment L5cL. As in A–D, synchronization of neuronal firing was higher during the npCDPs than during the nCDPs generated in the same segment of neuronal recordings (L5cL). G and H, CCs of the same neurones nA and nB during the nCDPs and npCDPs generated in the rostral part of segment L5 (L5rL). In this case, the neuronal CC was higher during the nCDPs than during the npCDPs. Limits of significance are indicated with dashed lines. See main text for further details.
Figure 7
Figure 7
Neuronal responses produced by electrical stimulation of cutaneous nerves and by mechanical stimulation of the skin A and B, onset latencies of neuronal activation following SP and sural (SU) nerve stimulation with single pulses of 1.15–1.8T applied at 1 Hz. C, number of segments in which the examined neurones increased their spontaneous firing during the nCDPs and/or npCDPs, divided by the total number of recorded segments (abscissa) versus percentage of neurones activated by low-strength (1.15–1.8T) electrical stimulation of the SU or SP nerves (ordinates). Linear adjustment and 95% confidence band are shown (see Methods). D, neuronal sensory fields disclosed with Von Frey filament stimulation of the hindlimb skin. E, spinal location of neurones responding to tactile skin stimulation. Colour codes in A, B, D and E indicate increased neuronal activation during nCDPs and npCDPs (n+, np+), only during nCDPs (n+, np0), only during npCDPs (np+, 0) or no changes (n0, np0). Further explanations are given in the main text.
Figure 8
Figure 8
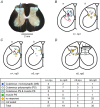
Intraspinal distribution of neuronal recording sites A, photograph of spinal section with recording micropipette. B, intraspinal location of 57 neurones whose spontaneous firing was increased during both nCDPs and npCDPs (n+, np+). Ba shows neurones responding to stimulation of muscle and cutaneous nerves and Bb neurones whose responses were not tested or failed to respond. Note that most neurones were around Rexed's laminae IV–VI. Ca, location of 19 neurones that increased activity only during nCDPs (n+, np0). Cb, location of six neurones firing only during npCDPs (n0, np+). D, location of 35 neurones whose activity was unchanged during nCDPs or npCDPs (n0, np0). Colour codes in the table indicate latency [monosynaptic (MS) or polysynaptic (PS)] of responses produced by stimulation of cutaneous and muscle nerves as well as the number of examined neurones. In Ba, the red ellipse encloses neurones responding to stimulation of muscle nerves. Red dots in Ba and Ca show the locations of the neurones illustrated in Figs 2 and 3, respectively. Note that most neurones associated with nCDPs and/or npCDPs responded to stimulation of cutaneous nerves, in contrast to neurones whose activity was not changed during nCDPs and npCDPs. Further explanations are given in the main text.
Figure 9
Figure 9
Inhibitory interactions between spontaneous and evoked activity of dorsal horn neurones AC, three sets of superimposed spontaneous L6-CDPs selected without baseline constraints. A, spontaneous nCDPs. B and C, spontaneous npCDPs. D, L6-CDPs and L6-DRPs produced by single stimuli of 3.2T applied once per second through a pair of needles inserted in the left footpad. E, dot-template-selected L6-nCDPs. F, test CDPs and DRPs produced by stimuli applied 50 ms after the peak of the ‘conditioning’ nCDPs. Note the reduction of footpad responses even though the nCDPs occurred without associated negative DRPs (see high-gain DRP trace below). GI, same as D–F. The test stimulus was applied during the positive phase of the L6-npCDPs that were generated together with negative DRPs (see high-gain trace below). Note the depression of the CDPs and DRPs produced by footpad stimulation. Percentage changes of test responses relative to control values are indicated. Traces D–I are the means of 32 responses. Further explanations are given in the main text.
Figure 10
Figure 10
Diagrams of separate versus common networks of dorsal horn neurones controlling class I and class II interneurones A, separate sets of dorsal horn local neurones modulate the activity of class I and class II interneurones, as proposed by Rudomin et al. (1987). Activation of class I glycinergic interneurones by one set of dorsal horn neurones (marked in blue) facilitates transmission along the pathways mediating Ib non-reciprocal postsynaptic inhibition in motoneurones (MNs) and Clarke's column (CCol) neurones. Another set of dorsal horn neurones (marked in red) activates class II GABAergic interneurones that synapse with Ia afferents and motoneurones. B and C, diagrams based on the present observations. We assume that the same distributed network of dorsal horn neurones differentially modulates the activity of class I and class II interneurones. B shows that during low levels of dorsal horn neuronal synchronization, class I interneurones (in blue) are preferentially activated relative to class II interneurones (in pink) and generate nCDPs practically without DRPs (lower set of records). C shows that increased synchronization between dorsal horn neurones increases activation of dorsal horn neurones (inactive neurones in white) and recruits class II interneurones (marked in red), leading to preferential activation of pathways mediating primary afferent depolarization (PAD) and presynaptic inhibition and generate the npCDPs and DRPs as shown by the lower set of records. Activation of class I interneurones without concurrent DRPs (lower traces in B) is assumed to result from reciprocal inhibitory interactions between class I and class II interneurones and between class I neurones and dorsal horn neurons, as indicated by interrupted lines and question marks. Note that in B and C different sets of last-order GABAergic interneurones are assumed to produce PAD in group Ia muscle and cutaneous afferents (see Jankowska et al. 1981). See main text for further details.

Similar articles

Cited by

References

    1. Ashrafi S, Betley JN, Comer JD, Brenner-Morton S, Bar V, Shimoda Y, Watanabe K, Peles E, Jessell TM. Kaltschmidt J. Neuronal Ig/Caspr recognition promotes the formation of axoaxonic synapses in mouse spinal cord. Neuron. 2014;81:120–129. - PMC - PubMed
    1. Bannatyne BA, Edgley SA, Hammar I, Jankowska E. Maxwell DJ. Differential projections of excitatory and inhibitory dorsal horn interneurons relaying information from group II muscle afferents in the cat spinal cord. J Neurosci. 2006;26:2871–2880. - PMC - PubMed
    1. Bannatyne BA, Liu TT, Hammar I, Stecina K, Jankowska E. Maxwell DJ. Excitatory and inhibitory intermediate zone interneurons in pathways from feline group I and II afferents: differences in axonal projections and input. J Physiol. 2009;587:379–399. - PMC - PubMed
    1. Bazelot M, Dinocourt C, Cohen I. Miles R. Unitary inhibitory field potentials in the CA3 region of the rat hippocampus. J Physiol. 2010;588:2077–2090. - PMC - PubMed
    1. Biella G, Riva L. Sotgiu ML. Interaction between neurons in different laminae of the dorsal horn of the spinal cord. A correlation study in normal and neuropathic rats. Eur J Neurosci. 1997;9:1017–1025. - PubMed

Publication types

LinkOut - more resources