. 2015 Apr;199(4):1107-25.
doi: 10.1534/genetics.115.174714. Epub 2015 Feb 4.

Nascent transcription affected by RNA polymerase IV in Zea mays

Affiliations

Nascent transcription affected by RNA polymerase IV in Zea mays

Karl F Erhard Jr et al. Genetics. 2015 Apr.

Abstract

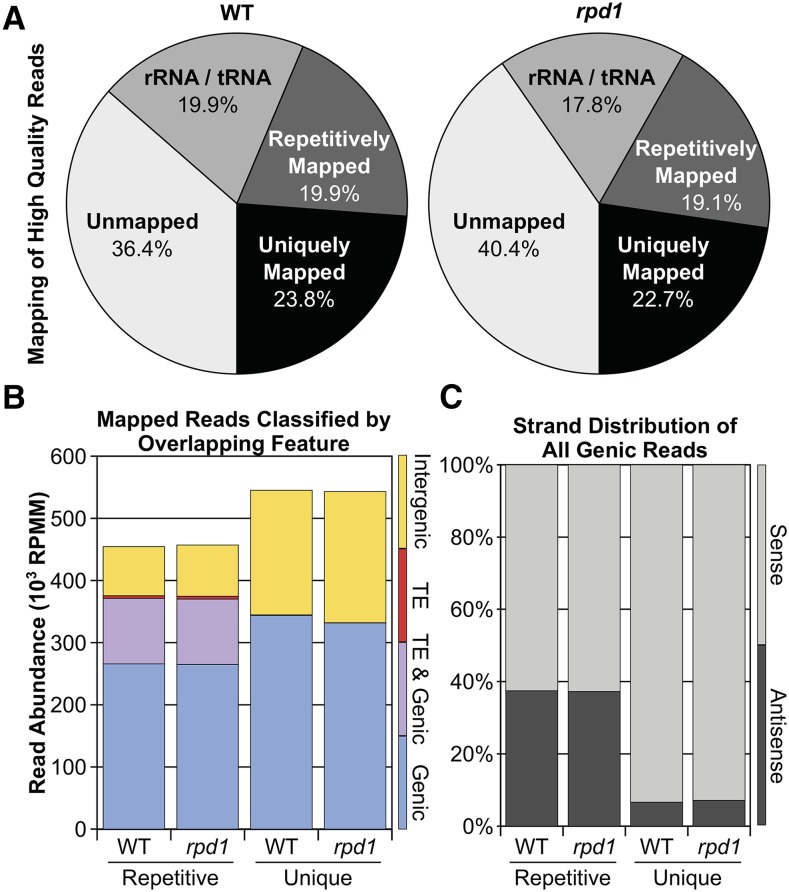
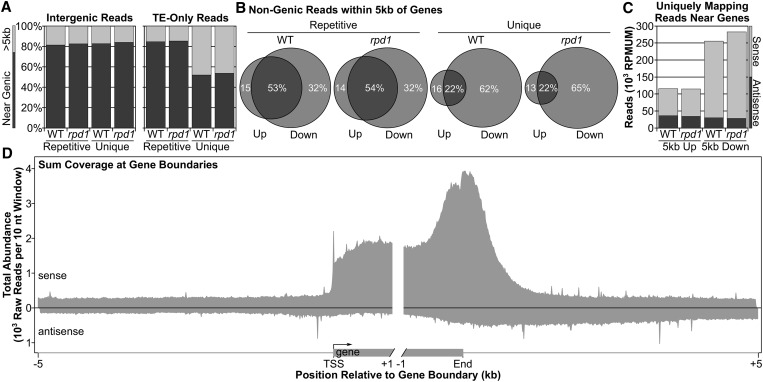
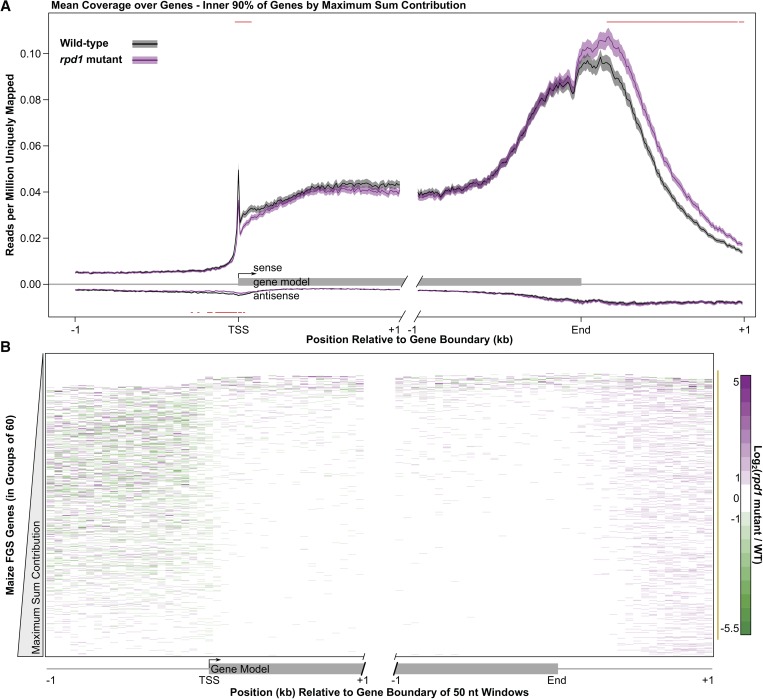
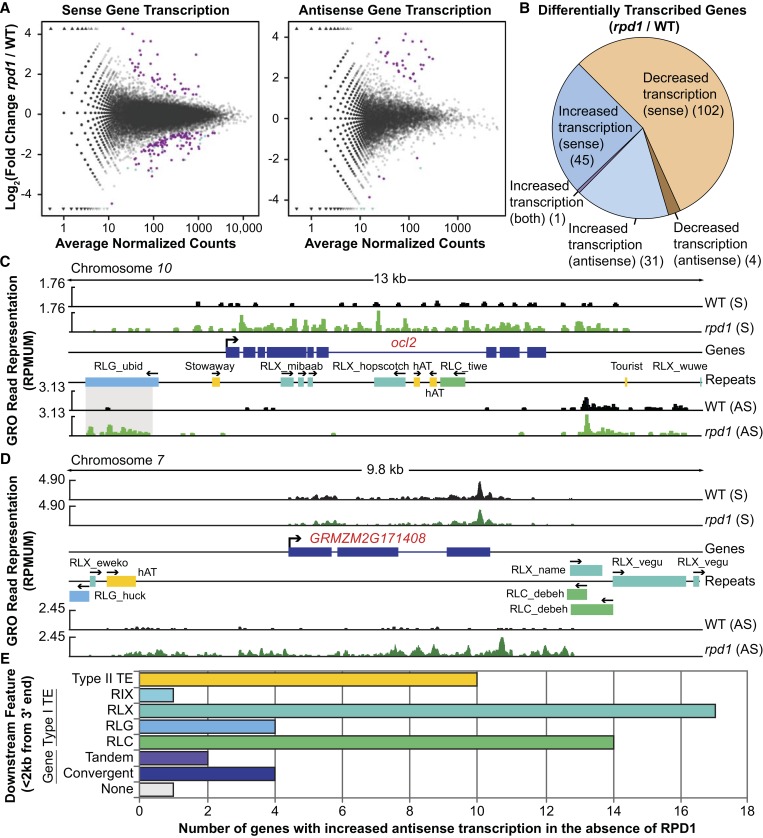
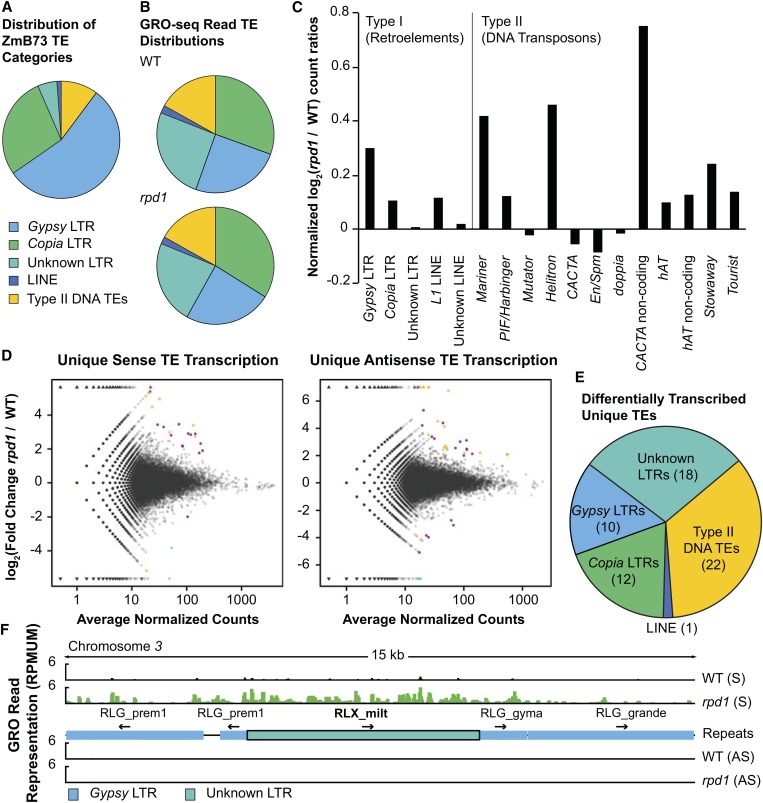
All eukaryotes use three DNA-dependent RNA polymerases (RNAPs) to create cellular RNAs from DNA templates. Plants have additional RNAPs related to Pol II, but their evolutionary role(s) remain largely unknown. Zea mays (maize) RNA polymerase D1 (RPD1), the largest subunit of RNA polymerase IV (Pol IV), is required for normal plant development, paramutation, transcriptional repression of certain transposable elements (TEs), and transcriptional regulation of specific alleles. Here, we define the nascent transcriptomes of rpd1 mutant and wild-type (WT) seedlings using global run-on sequencing (GRO-seq) to identify the broader targets of RPD1-based regulation. Comparisons of WT and rpd1 mutant GRO-seq profiles indicate that Pol IV globally affects transcription at both transcriptional start sites and immediately downstream of polyadenylation addition sites. We found no evidence of divergent transcription from gene promoters as seen in mammalian GRO-seq profiles. Statistical comparisons identify genes and TEs whose transcription is affected by RPD1. Most examples of significant increases in genic antisense transcription appear to be initiated by 3'-proximal long terminal repeat retrotransposons. These results indicate that maize Pol IV specifies Pol II-based transcriptional regulation for specific regions of the maize genome including genes having developmental significance.

Keywords: RNA polymerase IV; gene regulation; paramutation; transcription; transposons.


Figures

Figure 1
Figure 1
GRO-seq reads are similarly distributed in WT and rpd1 mutant libraries. (A) Percentages of WT and rpd1 mutant GRO-seq reads that are unmappable, map to rRNA/tRNA sequences, map repetitively (>1 alignment), or map uniquely to the B73 reference genome. (B) Distribution of repetitively and uniquely mapped reads [reads per million mapped (RPMM)] from A to annotated genes (blue), TEs (red), both (purple), or neither (intergenic; yellow). (C) Strandedness of the best alignment to gene models of all potentially genic reads (those that align with genes only or with both genes and TEs; blue and purple regions from B, respectively).
Figure 2
Figure 2
Nongenic GRO-seq reads are enriched near genes. (A) Percentage of nongenic/non-TE (intergenic) or TE-only reads that align near genes (within 5 kb; dark gray) or >5 kb (light gray) from genes. (B) Nongenic reads within 5 kb of genes found exclusively upstream (Up, left circle), downstream (Down, right circle), or at both ends (intersection) of a nearby gene. (C) Distribution of uniquely mapping near-genic reads [reads per million uniquely mapped (RPMUM)] by strand orientation relative to the nearby gene model. (D) Metagene profile of uniquely mapping WT GRO-seq reads summed over 10-nt windows ±5 kb from FGS models.
Figure 3
Figure 3
Pol IV loss alters global transcription profiles at gene boundaries. (A) WT and rpd1 mutant mean GRO-seq read coverage (black and purple lines, respectively) of 90% of the maize genes within 1 kb of gene start (TSS) or 3′ end (End). Gray and purple shading represent 95% confidence intervals; red horizontal bars highlight 10-nt nonoverlapping windows that significantly differ between libraries (Welch’s t-test by window, corrected to α = 0.05 with the Holm–Bonferroni method for multiple sampling). (B) Variation in coverage between WT and rpd1 mutant libraries for all FGS genes. Fold change was calculated from the average coverage (reads per million uniquely mapped) of 60 neighboring genes when sorted by their maximum sum contribution. Fifty-nucleotide windows with zero coverage in either library are plotted in white. The gold bar highlights the inner 90% of genes used in A.
Figure 4
Figure 4
Specific alleles are susceptible to Pol IV-induced changes in gene expression. (A) Across FGS gene bodies, the log2 fold change (rpd1 mutant/WT) of uniquely mapping read coverage vs. total coverage (average of WT and rpd1 mutant reads). Triangles represent genes with infinite fold change due to zero coverage from WT (top) or rpd1 mutant (bottom) uniquely mapping reads. Of the 39,656 FGS gene bodies analyzed, those with zero coverage in both WT and rpd1 mutant datasets (7783 and 9667 for sense and antisense strand transcription, respectively) were excluded from the plots. Purple dots represent genes with significantly (by the DESeq statistical method of Anders and Huber 2010; see Materials and Methods) increased or decreased GRO-seq read representation in rpd1 mutants. Teal dots represent genes within 20 Mb of the rpd1 locus whose decreased transcription in rpd1 mutants may reflect alignment artifacts (see Materials and Methods) and are excluded from subsequent analysis. (B) Distribution of categories (by direction of the change and strand) among transcriptionally altered genes in rpd1 mutants. (C) Genome browser view of WT (black peaks) and rpd1 mutant (green peaks) GRO-seq reads [normalized to reads per million uniquely mapped (RPMUM)] in sense (S) and antisense (AS) orientation over the ocl2-coding region and ∼3 kb of flanking genomic sequences on chromosome 10. Gray-shaded area highlights the ubid TE fragment 5′ of ocl2 having increased transcription in rpd1 mutants. (D) Gene browser view of GRMZM2G171408 showing increased antisense transcription in rpd1 mutants. Sense (S) and antisense (AS) transcription occur in distinct units of GRO-seq coverage in both WT (black peaks) and rpd1 mutant (green peaks) libraries. (E) Distribution of downstream features within 2 kb by type. Type I TEs are subdivided into LINE-like elements (RIX) and Copia (RLC), Gypsy (RLG), and Unknown (RLX) classes of LTR TEs. Color coding in E applies to TEs in browser views. Arrows indicate orientation of gene and TE features.
Figure 5
Figure 5
Pol IV loss affects both entire TE families and individual elements. (A) Distribution of TE categories within the B73 genome (Schnable et al. 2009). (B) Distribution of total (unique and repetitive) WT and rpd1 mutant GRO-seq reads within the different TE categories shown in A. (C) Log2 ratios (rpd1 mutant/WT) of GRO-seq reads, normalized to total mappable reads, mapping to annotated TE superfamilies. (D) Log2 fold change (rpd1 mutant/WT) of uniquely mapping reads in sense and antisense orientation to genomic regions annotated as TEs vs. total coverage (averages of WT and rpd1 mutant reads) to those regions. Triangles represent TEs with infinite fold change due to zero coverage from WT (top) or rpd1 mutant (bottom) uniquely mapping reads. Of the 1,612,638 TE annotations analyzed, those with zero coverage in both WT and rpd1 mutant datasets (1,392,382 and 1,399,008 for sense and antisense strand transcription, respectively) were excluded from the plots. Purple dots represent TEs with significantly (by the DESeq statistical method of Anders and Huber 2010; see Materials and Methods) increased or decreased GRO-seq read representation in rpd1 mutants; orange stars or triangles represent those differentially transcribed TEs farther than 5 kb from the nearest FGS gene. Teal dots represent TEs within 20 Mb of the rpd1 locus whose decreased transcription in rpd1 mutants may reflect alignment artifacts (see Materials and Methods) and are excluded from subsequent analysis. (E) Distribution of transcriptionally altered unique TEs among TE categories shown in A. (F) Genome browser view of WT (black peaks) and rpd1 mutant (green peaks) GRO-seq reads [normalized to reads per million uniquely mapped (RPMUM)] in sense (S) and antisense (AS) orientation over a 15-kb interval on chromosome 3 containing an RLX_milt type I element with increased transcription in rpd1 mutants. Only the element outlined in black has significantly altered GRO-seq read representation in rpd1 mutants based on the statistical threshold used (Anders and Huber 2010; see Materials and Methods).

Similar articles

Cited by

References

    1. Alleman M., Sidorenko L., McGinnis K., Seshadri V., Dorweiler J. E., et al. , 2006. An RNA-dependent RNA polymerase is required for paramutation in maize. Nature 442: 295–298. - PubMed
    1. Anders S., Huber W., 2010. Differential expression analysis for sequence count data. Genome Biol. 11: R106. - PMC - PubMed
    1. Ariel F., Jegu T., Latrasse D., Romero-Barrios N., Christ A., et al. , 2014. Noncoding transcription by alternative RNA polymerases dynamically regulates an auxin-driven chromatin loop. Mol. Cell 55: 383–396. - PubMed
    1. Ashe A., Sapetschnig A., Weick E.-M., Mitchell J., Bagijn M. P., et al. , 2012. piRNAs can trigger a multigenerational epigenetic memory in the germline of C. elegans. Cell 150: 88–99. - PMC - PubMed
    1. Barber W. T., Zhang W., Win H., Varala K. K., Dorweiler J. E., et al. , 2012. Repeat associated small RNAs vary among parents and following hybridization in maize. Proc. Natl. Acad. Sci. USA 109: 10444–10449. - PMC - PubMed

Publication types

MeSH terms

Substances