. 2015 Feb 4;35(5):1858-71.
doi: 10.1523/JNEUROSCI.2900-14.2015.

Developmental tightening of cerebellar cortical synaptic influx-release coupling

Affiliations

Developmental tightening of cerebellar cortical synaptic influx-release coupling

David Baur et al. J Neurosci. .

Abstract

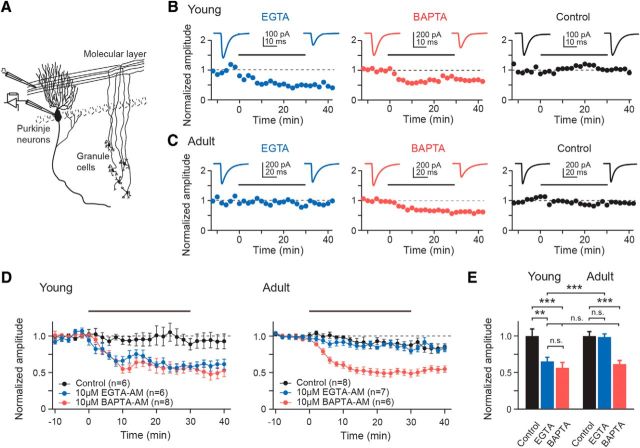
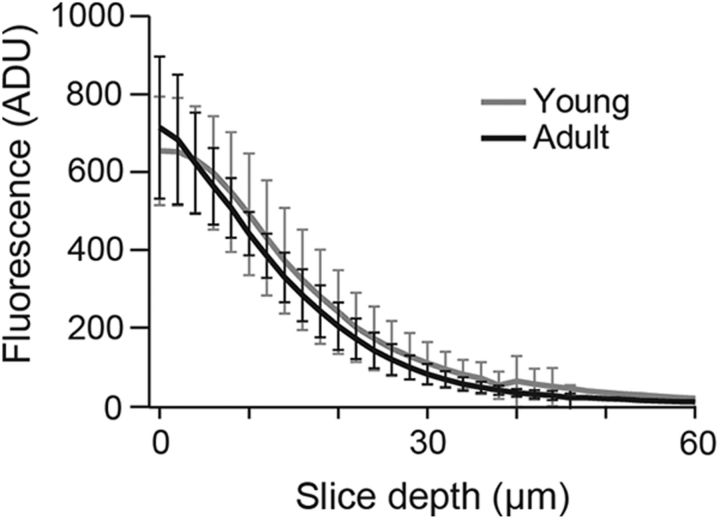
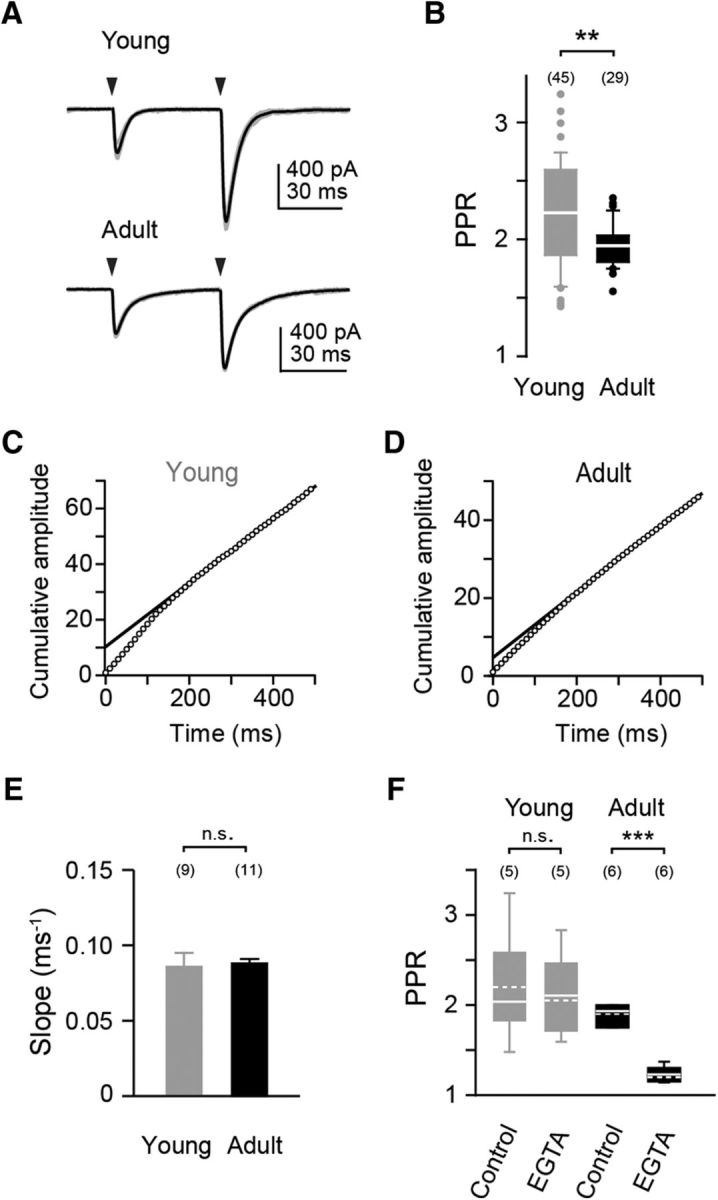
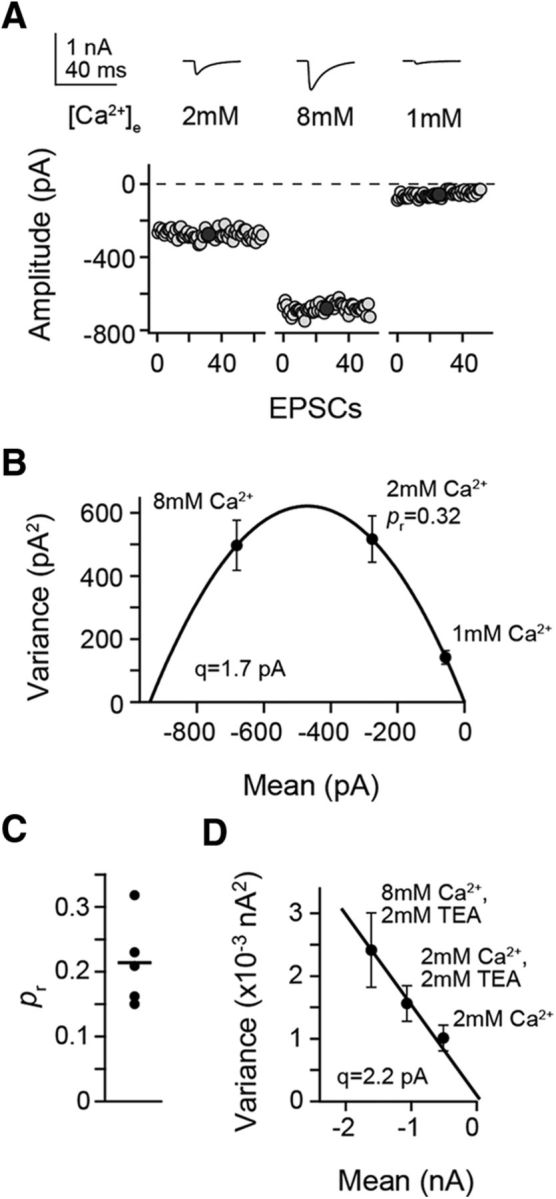
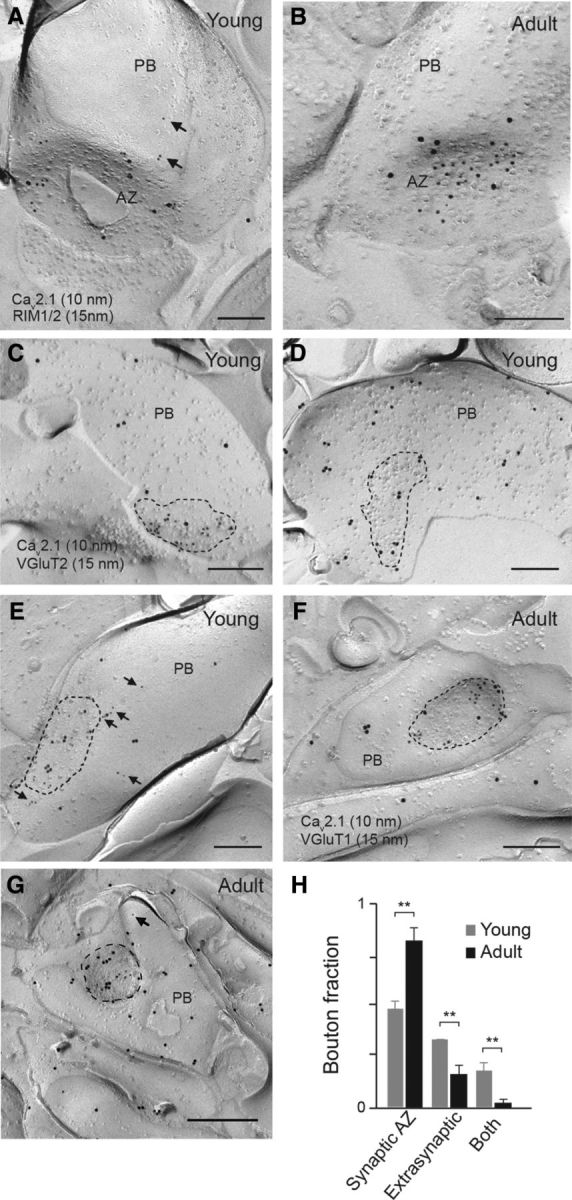
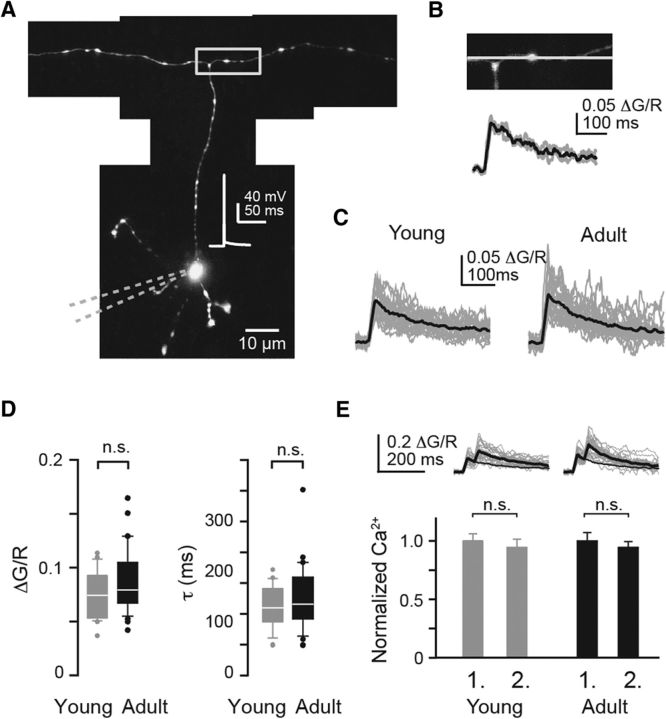
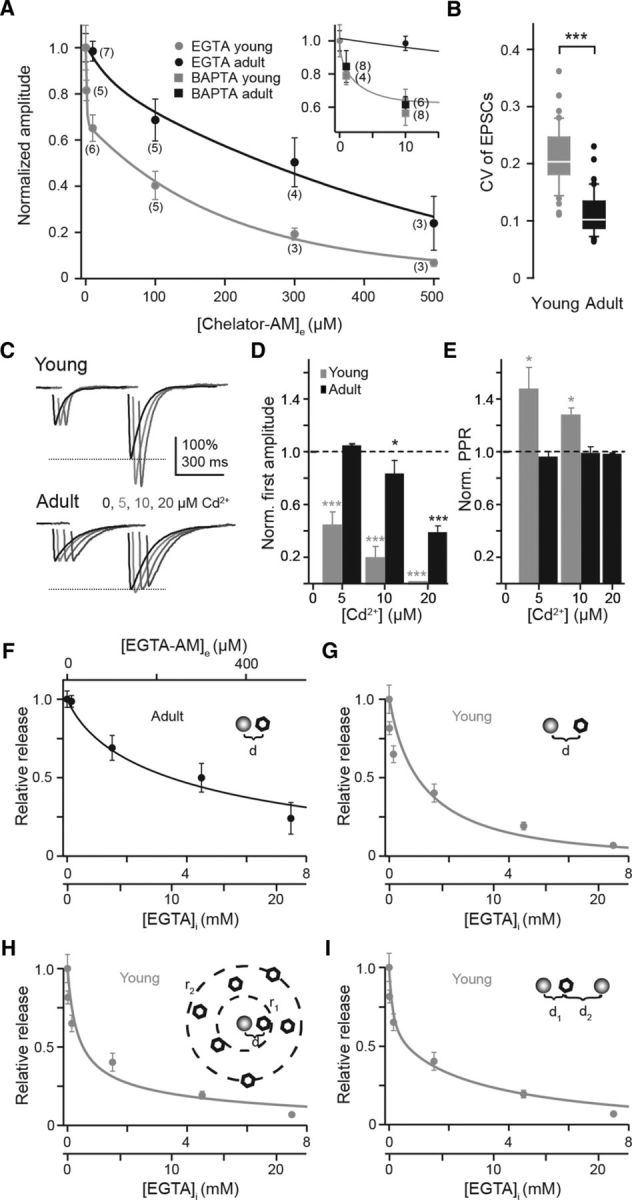
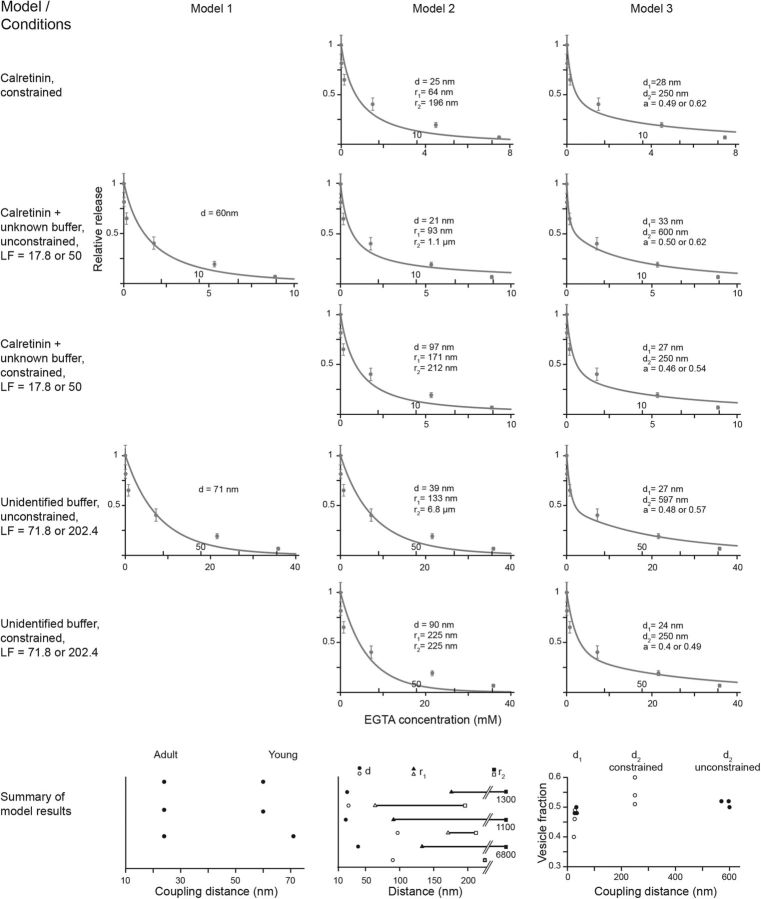
Tight coupling between Ca(2+) channels and the sensor for vesicular transmitter release at the presynaptic active zone (AZ) is crucial for high-fidelity synaptic transmission. It has been hypothesized that a switch from a loosely coupled to a tightly coupled transmission mode is a common step in the maturation of CNS synapses. However, this hypothesis has never been tested at cortical synapses. We addressed this hypothesis at a representative small cortical synapse: the synapse connecting mouse cerebellar cortical parallel fibers to Purkinje neurons. We found that the slow Ca(2+) chelator EGTA affected release significantly stronger at immature than at mature synapses, while the fast chelator BAPTA was similarly effective in both groups. Analysis of paired-pulse ratios and quantification of release probability (pr) with multiple-probability fluctuation analysis revealed increased facilitation at immature synapses accompanied by reduced pr. Cav2.1 Ca(2+) channel immunoreactivity, assessed by quantitative high-resolution immuno-electron microscopy, was scattered over immature boutons but confined to putative AZs at mature boutons. Presynaptic Ca(2+) signals were quantified with two-photon microscopy and found to be similar between maturation stages. Models adjusted to fit EGTA dose-response curves as well as differential effects of the Ca(2+) channel blocker Cd(2+) indicate looser and less homogenous coupling at immature terminals compared with mature ones. These results demonstrate functionally relevant developmental tightening of influx-release coupling at a single AZ cortical synapse and corroborate developmental tightening of coupling as a prevalent phenomenon in the mammalian brain.

Keywords: calcium channels; calcium chelators; coupling; presynaptic calcium; release probability; short-term plasticity.


Conflict of interest statement

The authors declare no competing financial interests.

Figures

Figure 1.
Figure 1.
Ca2+ chelator effects suggest developmental tightening of coupling. A, Recording scheme: EPSCs were evoked in whole-cell patch-clamped PNs by extracellular stimulation of PF tracts in acute slices. B, Examples of recordings from PF-PN connections in young slices (2 min binning). Following baseline recordings (10 min), slices were incubated for 30 min (bars) in 10 μm EGTA-AM (blue), 10 μm BAPTA-AM (red), or ACSF supplemented only with DMSO/Pluronic (control, black). Incubation was followed by a 10 min washout. Insets, Average EPSCs during baseline and washout. C, As in B but for adult connections. D, Average data (mean ± SEM) recorded from young and adult connections. Data were normalized to the average EPSC amplitude during baseline. E, Summary of chelator-AM-induced EPSC reductions. EPSC amplitudes from D were averaged over the 10 min washout period and normalized to the average control amplitude (n as in D).
Figure 2.
Figure 2.
Comparable AM-based loading in young and adult tissue. Background-corrected fluorescence intensities (ADU, arbitrary digital units) versus depth from slice surface in the molecular layer from young and adult mice (gray and black, respectively; mean and 95% confidence intervals, n = 6 each, p = 1.0). Slices were incubated for 30 min with the fluorescent dye calcein-AM (10 μm). Fluorescence measurements were performed 10 min after washout of the dye.
Figure 3.
Figure 3.
Short-term plasticity and vesicle replenishment in young and adult PF synapses. A, Examples of PPF in young and adult synapses [averages (black) of five repeats (gray)]. The arrowhead denotes the time point of stimulation. B, Box-and-whisker plot summarizing the PPR data. Median and IQR, outliers are denoted by points. The number of cells is denoted in parentheses. C, Cumulative EPSC amplitudes during a 100 Hz train of synaptic activation. Example recording from a young mouse. Data were normalized to the amplitude of the first EPSC. The solid line represents a linear fit to the steady-state phase (200–500 ms; slope = 0.1, y-intercept = 10) of the cumulative current. D, Same as in C but in a recording from an adult mouse (slope = 0.08, y-intercept = 5). E, Bar graph of slope values in young (n = 9, gray) and adult (n = 11, black) mice. F, Bar graph summarizing PPRs in recordings from young and adult mice before (control) and after application of 100 μm EGTA-AM (***p < 0.001). Solid and dashed lines indicate median and mean values, respectively.
Figure 4.
Figure 4.
Developmental changes in release probability. A, Fluctuation of EPSC amplitudes recorded at the indicated [Ca2+]e from an adult PN during PF stimulation. B, Variance-mean plot of the EPSCs in A fitted by a parabola, yielding the quantal parameters q and pr. C, Summary of pr in the adult (n = 5). The line indicates the mean value. D, As in B but in a young animal. Data fit to a straight line due to very low pr (Foster et al., 2005).
Figure 5.
Figure 5.
Developmental focusing of Cav2.1 immunoreactivity to the AZ of parallel fiber boutons. A, B, Electron micrographs showing the colocalization of Cav2.1 (10 nm gold particles) and the presynaptic AZ proteins RIM1/2 (15 nm particles) in the presynaptic plasma membrane of parallel fiber boutons (PB) from young (P8, A) and adult (P21, B) mice, as assessed by the SDS-FRL. Cav2.1 labeling was observed mostly at the presynaptic membrane specialization, i.e., at putative AZs (A, B) and, in the case of young animals, also outside the AZ (A, arrows). C–G, Immunolabeling for Cav2.1 (10 nm particles) and VGluT1 (adult) or VGluT2 (young; 15 nm particles) on the protoplasmic face of young (C–E) and adult (F, G) PB. Clusters (C) or isolated (D) immunoparticles for Cav2.1 were observed at putative AZs (dashed lines) but also outside (E, arrows) of AZs in young mice, whereas in adult boutons (F, G) virtually all Cav2.1 channels were detected at AZs and particles were only rarely seen extrasynaptically (arrow in G). H, Fractions of VGluT-positive young (gray, n = 182, 2 animals) and adult (black, n = 242, 2 animals) boutons showing Cav2.1 immunoreactivity exclusively inside (synaptic AZ; p = 0.003), outside (extrasynaptic; p = 0.004), or inside and outside (both; p = 0.002) of putative AZs. Note that the AZ fraction substantially increased with synapse maturation. Scale bars: A–G, 200 nm.
Figure 6.
Figure 6.
Presynaptic Ca2+ signals were not altered during development. A, Two-photon image of a young GC loaded via a somatic patch pipette (dashed lines) containing 200 μm Fluo-5F and 50 μm Alexa 594. Inset, Somatically evoked AP. B, Top, PF bouton outlined in A from which single AP-mediated fluorescence signals were recorded in the line scan mode. Bottom, ΔG/R signals from three individual recordings (gray) from the bouton and their average (black). C, ΔG/R signals averaged across individual young (n = 21) and adult (n = 28) boutons (gray) and their grand averages (black). D, Amplitudes (ΔG/R) and decay constants (τ) of Ca2+ signals in young and adult boutons. E, PPR of ΔG/R signals (20 Hz). Top, Averages of individual boutons (gray) and grand averages (black). The decay of the first transient was extrapolated and the second amplitude was measured to the decay of the first. Bottom, Amplitudes of the first and the second Ca2+ signal normalized to the first amplitude.
Figure 7.
Figure 7.
Chelator-AM dose–response curves quantify looser coupling at young PF terminals. A, EGTA-AM (circles) dose–response curves (mean ± SEM) of young (gray) and adult (black) connections. Data points were calculated from EPSCs recorded during the 10 min washout period following 30 min of chelator-AM application (compare Fig. 1). Lines represent exponential (black) or biexponential (gray) fits. Inset, Expanded curves with BAPTA-AM data (squares) included. B, CV of EPSC amplitudes in adult (black, n = 42) and young (gray, n = 40). C, Example EPSCs (average of 10 traces each) recorded from a young (top) or adult (bottom) PN during PF paired-pulse stimulation (50 ms ISI) showing the effect of the indicated concentrations of extracellularly applied Cd2+ (different shades of gray; 0 = control, black; traces were offset in time to each other for clarity) on the PPR. EPSCs are normalized to the first amplitude. The dashed line indicates the amplitude of the second EPSC recorded under control conditions. Note that the PPR increased in the presence of Cd2+ in the young cell but remained unaltered in the adult one. D, E, Bar graphs summarizing the effect of Cd2+ on the amplitude of the first EPSC (D) and the PPR (E) in young (gray; n = 6; EPSCs: ***p < 0.001; PPR: *p = 0.013 or 0.041) and adult (black; n = 4; EPSCs: *p = 0.04, ***p < 0.001; PPR: p = 0.91). Values (mean ± SE) were normalized to control values (dashed lines). EPSCs were completely blocked by 20 μm Cd2+ in the young, preventing the calculation of PPR for this concentration. F, Data from the adult from A fitted (black) by Model 1 with d set to 24 nm and an EGTA-AM LF as variable. The bottom x-axis has a dual scale according to estimates of intracellular EGTA concentrations obtained with different LFs of 15 or 42 that result from different published values for kon,EGTA and KD,EGTA (see Materials and Methods). G, Data from young animals in A were plotted against estimated intracellular EGTA concentration (cf. text and F) and fitted (gray) by Model 1 with d as a variable. The fit gave an estimate for d of 60 nm. With the two different EGTA-dependent LFs the fit curves completely overlapped with identical estimates of d. H, Data from the young as in G fitted with a channel-cluster model (Model 2; d = 23 nm, r1 = 176 nm, r2 = 1.3 μm). I, As in G but for a two-vesicle pool model (Model 3; d1 = 35 nm, d2 = 570 nm, a = 0.48 or 0.61 for LF = 15 or 42, respectively).
Figure 8.
Figure 8.
Model variants show looser coupling in young animals. Fits of Models 1–3 to the EGTA dose–response data (Fig. 7) from young connections. The model conditions were varied as indicated in the left column by using calretinin alone, or calretinin plus an unknown buffer (Schmidt et al., 2013), or only an unidentified buffer (Sabatini and Regehr, 1998) as endogenous Ca2+ buffer (cf. Material and Methods for buffer parameters). The intracellular EGTA concentrations were estimated by first deriving the AM LF by fitting data from the adult as in Figure 7F. Models were either run unconstrained or using the estimated size of 250 nm of the AZ as constraint. The lower row shows a summary of the best-fit parameters derived by Models 1 (left), 2 (middle, open symbols show results from constrained fits), or 3 (right; for clarity only results obtained with the parameters for EGTA given by Nägerl et al. (2000) are shown). Note that regardless of model details increased distances are predicted for at least a fraction of release-relevant channel to vesicle distances.

References

    1. Adler EM, Augustine GJ, Duffy SN, Charlton MP. Alien intracellular calcium chelators attenuate neurotransmitter release at the squid giant synapse. J Neurosci. 1991;11:1496–1507. - PMC - PubMed
    1. Allbritton NL, Meyer T, Stryer L. Range of messenger action of calcium ion and inositol 1,4,5-trisphosphate. Science. 1992;258:1812–1815. doi: 10.1126/science.1465619. - DOI - PubMed
    1. Arendt O, Schwaller B, Brown EB, Eilers J, Schmidt H. Restricted diffusion of calretinin in cerebellar granule cell dendrites implies Ca2+-dependent interactions via its EF-hand 5 domain. J Physiol. 2013;591:3887–3899. - PMC - PubMed
    1. Atluri PP, Regehr WG. Determinants of the time course of facilitation at the granule cell to Purkinje cell synapse. J Neurosci. 1996;16:5661–5671. - PMC - PubMed
    1. Atluri PP, Regehr WG. Delayed release of neurotransmitter from cerebellar granule cells. J Neurosci. 1998;18:8214–8227. - PMC - PubMed

Publication types

Substances