. 2015 Feb 4;35(5):1939-53.
doi: 10.1523/JNEUROSCI.1731-14.2015.

Motivation and affective judgments differentially recruit neurons in the primate dorsolateral prefrontal and anterior cingulate cortex

Affiliations

Motivation and affective judgments differentially recruit neurons in the primate dorsolateral prefrontal and anterior cingulate cortex

Ken-ichi Amemori et al. J Neurosci. .

Abstract

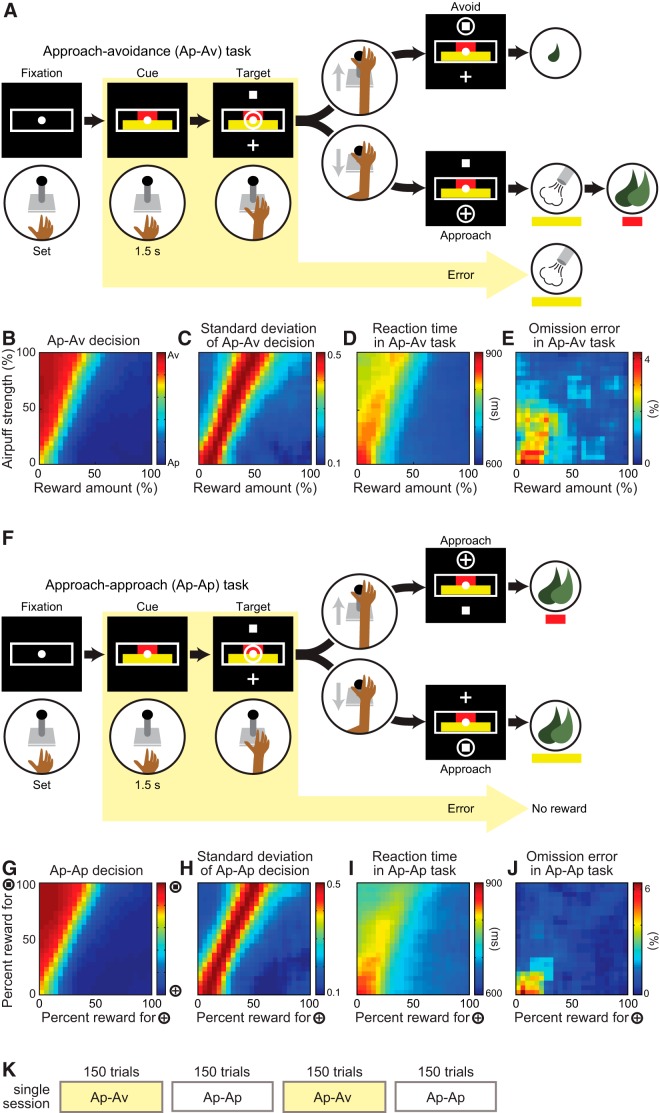
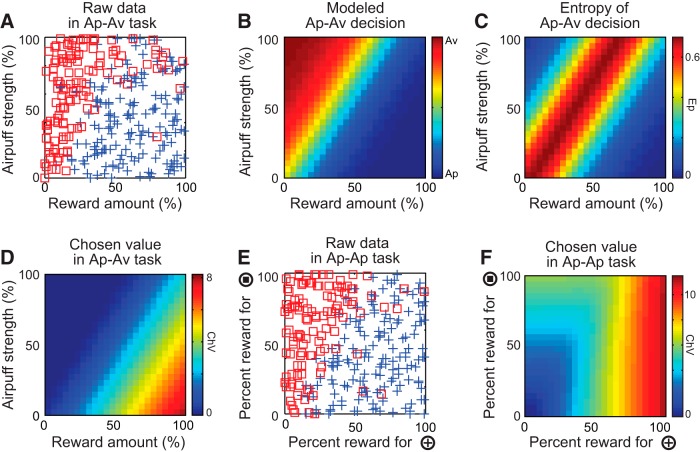
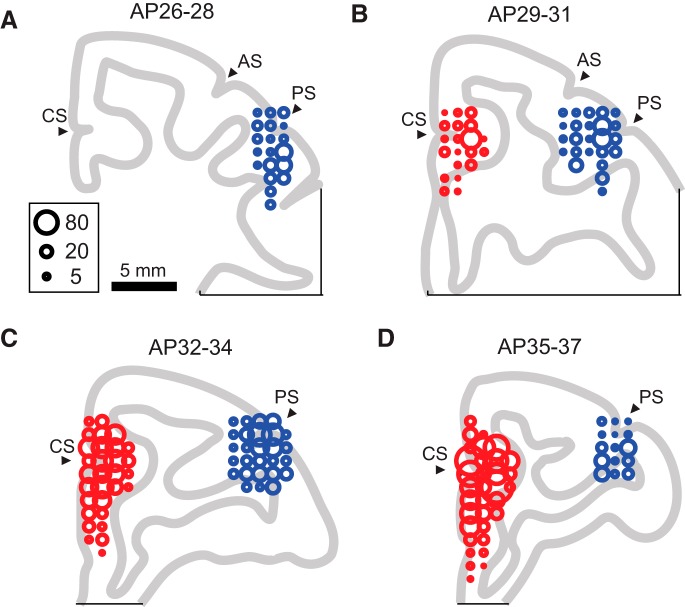
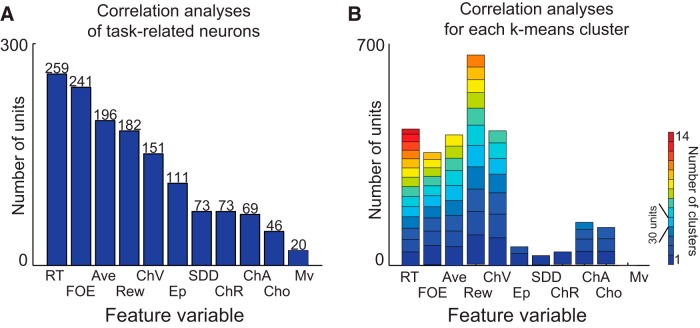
The judgment of whether to accept or to reject an offer is determined by positive and negative affect related to the offer, but affect also induces motivational responses. Rewarding and aversive cues influence the firing rates of many neurons in primate prefrontal and cingulate neocortical regions, but it still is unclear whether neurons in these regions are related to affective judgment or to motivation. To address this issue, we recorded simultaneously the neuronal spike activities of single units in the dorsolateral prefrontal cortex (dlPFC) and the anterior cingulate cortex (ACC) of macaque monkeys as they performed approach-avoidance (Ap-Av) and approach-approach (Ap-Ap) decision-making tasks that can behaviorally dissociate affective judgment and motivation. Notably, neurons having activity correlated with motivational condition could be distinguished from neurons having activity related to affective judgment, especially in the Ap-Av task. Although many neurons in both regions exhibited similar, selective patterns of task-related activity, we found a larger proportion of neurons activated in low motivational conditions in the dlPFC than in the ACC, and the onset of this activity was significantly earlier in the dlPFC than in the ACC. Furthermore, the temporal onsets of affective judgment represented by neuronal activities were significantly slower in the low motivational conditions than in the other conditions. These findings suggest that motivation and affective judgment both recruit dlPFC and ACC neurons but with differential degrees of involvement and timing.

Keywords: anterior cingulate cortex; decision making; macaque; prefrontal cortex; primate.


Conflict of interest statement

The authors declare no competing financial interests.

Figures

Figure 1.
Figure 1.
Task flow and decisions. A, The Ap–Av task started when the monkey put its hand on the designated position in front of the joystick. After a 1.5 s fixation period, two bars appeared on the screen. The length of the red and yellow bars indicated, respectively, the offered amount of food and airpuff delivered after approach choice. After a 1.5 s cue period, the monkey could move the joystick to the cross target to indicate an approach choice or to the square target for an avoidance choice. The locations of the two targets were randomized across trials. After approach decisions, both airpuff and food were delivered in the offered amounts. After avoidance decisions, the monkey did not receive the offered airpuff and food but received the smallest amount of food. When the monkey made commission or omission error, the airpuff was delivered at the strength indicated by the length of the yellow bar. B, Monkeys' decisions averaged over all 345 recording sessions in the Ap–Av task, plotted for combinations of the offered amount of reward (x-axis) and the offered strength of airpuff (y-axis). The color scale at the right indicates the proportion of choosing avoidance (red) or approach (blue). C–E, The SDD (C), average RTs (D), and FOE (E) in the Ap–Av task. F, In the Ap–Ap task, the length of the red and yellow bars corresponded to the amount of reward that the monkey could obtain after choosing cross and square targets, respectively. G, Monkeys' decisions in the Ap–Ap task, plotted for combinations of the offered amount of reward associated with cross target (x-axis) and the offered amount of reward associated with the square target (y-axis). H–J, The SD of the decisions (H), average RTs (I), and FOE (J) in the Ap–Ap task. K, The sequence of Ap–Av and Ap–Ap task blocks in a single recording session. The two tasks alternated every 150 trials.
Figure 2.
Figure 2.
Parametric modeling of the decisions by monkey S in a single session in the Ap–Av (A–D) and Ap–Ap (E, F) tasks. A, Avoidance (red square) and approach (blue cross) decisions made by the monkey in a single session of the Ap–Av task. B, The behavioral model derived by logistic regression with the dataset shown in A. The color scale indicating the probability of choosing avoidance (red) or approach (blue) is shown at the right. C, The Ep of Ap–Av decisions derived from the model. D, The ChV in the Ap–Av task estimated by the expected utility and derived from the model. E, Choices of square (red square) and cross (blue cross) targets during a single session of the Ap–Ap task. F, The ChV in the Ap–Ap task derived from the model.
Figure 3.
Figure 3.
Schematic drawing of coronal sections showing the recording sites. Units were recorded from the regions 26–28 (A), 29–31 (B), 32–34 (C), and 35–37 (D) mm anterior from the interaural line. The size of the circles indicates the number of units recorded at the location. Units recorded from the left hemisphere were mapped onto the right hemisphere. The ACC units (red circles) were recorded around the cingulate sulcus (CS), and the dlPFC units (blue circles) were recorded around the principal sulcus (PS). AC, Arcuate sulcus.
Figure 4.
Figure 4.
Procedure to select explanatory variables for regression analyses. Among 11 variables arbitrarily derived (Rew, Ave, ChV, Cho, ChR, ChA, RT, SDD, Ep, FOE, and Mv), we selected five variables (Rew, Ave, ChV, RT, and FOE). Both correlation (A) and k-means clustering (B) analyses ranked these as the top five variables that accounted for the unit properties. A, The correlation analyses were performed between the cue-period activity of each task-related unit and 11 variables. The feature variable for each unit was defined by the variable that exhibited the lowest p value for the Pearson's correlation coefficient among the 11 variables. The number of units with activity showing significant correlation (p < 0.05; y-axis) was shown for an individual feature variable (x-axis). B, The k-means algorithm lumped the units with similar activity without previous assumptions. For each cluster, the feature variable was defined as the variable that showed significant correlation (p < 0.05) with the activity of each unit in the cluster most frequently among the 11 variables. Each block represents a cluster, with the height of the block indicating the number of units in the cluster and the color of the block reflecting the number of clusters for the feature variable (small, bluish; large, reddish).
Figure 5.
Figure 5.
Unit classification. A, The number of units classified by the all-possible subset regression. Regression analyses for the cue-period activity were performed with all-possible combination of the five explanatory variables (Rew, Ave, ChV, RT, and FOE). The best combination of variables was selected based on BIC. The 1142 units explained by single variables were further separated into units with activity that was correlated positively (orange) or negatively (cyan) with the variable. Another 267 units were characterized by particular combinations of variables indicated by black squares in the matrix. B, The proportion of task-related units explained by single (43%) and combination (10%) of variables. C, Classification of units with all-possible subset regression analyses performed with different criteria (blue, BIC; red, Akaike information criteria; cyan, Mallow's Cp statistic) and with stepwise regression analyses (green). All analyses similarly categorized units with the five selected variables.
Figure 6.
Figure 6.
Properties of units with positive (Rew+, A) or negative (Rew−, B) correlations with offered reward and those with positive (Ave+, C) or negative (Ave−, D) correlations with offered aversion. In each panel, the top left shows the population activity relative to the offered amounts of reward (x-axis) and air puff (y-axis). The cue-period activity of each neuron was binned to an 8 × 8 matrix and normalized by the formula [Rate − min(Rate)]/[max(Rate) − min(Rate)], where Rate indicates the firing rate of each element in the matrix. Black contours divide the normalized activity into four quartiles. The numbers of units in the dlPFC and ACC are indicated, respectively, at the left and right of the plus sign. The top right shows the proportion of each type among all classified dlPFC and ACC units. The bottom shows the normalized activity around cue onset (time 0) for cue combinations that induced activity in the top (red), second (green), third (blue), and bottom (black) quartiles as defined in the top left. *p < 0.05, **p < 0.01, ***p < 0.001 (Fisher's exact test).
Figure 7.
Figure 7.
Properties of units showing positive (ChV+, A) or negative (ChV−, B) correlations with ChV and those with positive (RT+, C) and negative (RT−, D) correlations with RT. Normalized population activity (top left), the proportion of each type of units in the dlPFC and ACC (top right), and the temporal pattern of the population activity (bottom) are illustrated as in Figure 6. The proportion of RT+ units in the dlPFC was significantly larger than that in the ACC (*p < 0.05, Fisher's exact test).
Figure 8.
Figure 8.
Properties of motivation-type units. A, B, Normalized population activity (top left), proportion in the dlPFC and ACC (top right), and temporal pattern of the normalized activity (bottom) of low (FOE+, A) and high (FOE−, B) motivation units, illustrated as in Figure 6. The proportion of FOE+ units in the dlPFC was significantly larger than that in the ACC (*p < 0.05, Fisher's exact test). C, Discrimination of motivational conditions by individual dlPFC (top) and ACC (bottom) units. Color indicates the z value representing the degree of discrimination between low and high motivational conditions, which was defined by the preferred (top 2 quartiles) and nonpreferred (bottom 2 quartiles) cue combinations shown in the top left in A and B. D, E, Cumulative (D) and time-plot (E) distributions of discrimination onsets of the dlPFC (red) and ACC (blue) units. The discrimination onset was significantly earlier in the dlPFC than in the ACC in both cumulative (Kolmogorov–Smirnov test, **p < 0.01) and time-plot (Wilcoxon's rank-sum test, *p < 0.05) distributions. The median onset for the dlPFC population was 60 ms earlier than that for the ACC population.
Figure 9.
Figure 9.
Effects of low motivation on neuronal activity. A, Discrimination of upcoming acceptance and rejection by ChV units in high (top) and low (bottom) motivational conditions. B, C, Cumulative (B) and time-plot (C) distributions of the discrimination onsets between acceptance and rejection by ChV units. The discrimination onsets were significantly earlier in the high motivational condition than in the low motivational condition in both cumulative (Kolmogorov–Smirnov test, **p < 0.01) and time-plot (Wilcoxon's rank-sum test, **p < 0.01) distributions. The median onset time in the high motivational condition was 222 ms earlier than that in the low motivational condition. D, Temporal pattern of population activity of omission-type units around the cue onset (time 0) in omission error trials (red) and correct trials (blue). The numbers of dlPFC and ACC units are indicated, respectively, at the left and right of a plus sign. E, Categorization of omission-type units. Many (21 of 36, 58%) were not categorized by any of the five selected variables (Rew, Ave, ChV, RT, and FOE). None of them overlapped with motivation (FOE) units.
Figure 10.
Figure 10.
Encoded information was preserved across the Ap–Av and Ap–Ap tasks. Population cue-period activity of ChV+ (A), ChV− (B), FOE+ (C), and FOE− (D) units is plotted in relation to the combined cues in the Ap–Av (left) and Ap–Ap (middle) tasks according to the color scale at the right. Firing rates of each unit were baseline subtracted by the formula [Rate − min(Rate)], where Rate indicates the firing rate of each element in the matrix. The plots at the right show correlation coefficients between their cue-period activity and the ChV, calculated for each neuron and for each task. Units with significant correlation (Pearson's correlation, p < 0.05) in both tasks are marked by circles. Other units are marked by crosses. Dotted lines show mean correlation coefficients for each task. *p < 0.05, ***p < 0.001 (one-sample t test).
Figure 11.
Figure 11.
Motivation and ChV units are dissociable in the Ap–Av task. Differential activity between ChV+ and FOE− units in the Ap–Av (A) and Ap–Ap (C) tasks and between ChV− and FOE+ units in the Ap–Av (B) and Ap–Ap (D) tasks, plotted as z values (derived from two-sample t test) for the combined cues. Combined cues that induced significant differences between the two populations are indicated by dots (p < 0.05) and squares (p < 0.01). The r values indicate the two-dimensional correlation coefficients between the response patterns of ChV and FOE units, quantifying the similarity of two matrices. Firing rates of each unit were baseline subtracted by the formula [Rate − min(Rate)], where Rate indicates the firing rate of each element in the matrix.

References

    1. Amemori K, Graybiel AM. Localized microstimulation of primate pregenual cingulate cortex induces negative decision-making. Nat Neurosci. 2012;15:776–785. doi: 10.1038/nn.3088. - DOI - PMC - PubMed
    1. Amemori K, Sawaguchi T. Contrasting effects of reward expectation on sensory and motor memories in primate prefrontal neurons. Cereb Cortex. 2006;16:1002–1015. doi: 10.1093/cercor/bhj042. - DOI - PubMed
    1. Barraclough DJ, Conroy ML, Lee D. Prefrontal cortex and decision making in a mixed-strategy game. Nat Neurosci. 2004;7:404–410. doi: 10.1038/nn1209. - DOI - PubMed
    1. Belsley DA, Kuh E, Welsch RE. Regression diagnostics: Identifying influential data and sources of collinearity. New York: Wiley; 1980.
    1. Bradley MM, Codispoti M, Cuthbert BN, Lang PJ. Emotion and motivation I: Defensive and appetitive reactions in picture processing. Emotion. 2001;1:276–298. doi: 10.1037/1528-3542.1.3.276. - DOI - PubMed

Publication types

LinkOut - more resources