. 2015 Feb 4;35(5):2161-72.
doi: 10.1523/JNEUROSCI.3915-14.2015.

Individual differences reveal correlates of hidden hearing deficits

Affiliations

Individual differences reveal correlates of hidden hearing deficits

Hari M Bharadwaj et al. J Neurosci. .

Abstract

Clinical audiometry has long focused on determining the detection thresholds for pure tones, which depend on intact cochlear mechanics and hair cell function. Yet many listeners with normal hearing thresholds complain of communication difficulties, and the causes for such problems are not well understood. Here, we explore whether normal-hearing listeners exhibit such suprathreshold deficits, affecting the fidelity with which subcortical areas encode the temporal structure of clearly audible sound. Using an array of measures, we evaluated a cohort of young adults with thresholds in the normal range to assess both cochlear mechanical function and temporal coding of suprathreshold sounds. Listeners differed widely in both electrophysiological and behavioral measures of temporal coding fidelity. These measures correlated significantly with each other. Conversely, these differences were unrelated to the modest variation in otoacoustic emissions, cochlear tuning, or the residual differences in hearing threshold present in our cohort. Electroencephalography revealed that listeners with poor subcortical encoding had poor cortical sensitivity to changes in interaural time differences, which are critical for localizing sound sources and analyzing complex scenes. These listeners also performed poorly when asked to direct selective attention to one of two competing speech streams, a task that mimics the challenges of many everyday listening environments. Together with previous animal and computational models, our results suggest that hidden hearing deficits, likely originating at the level of the cochlear nerve, are part of "normal hearing."

Keywords: central auditory processing disorders; cochlear neuropathy; envelope-following response; frequency-following response; hidden hearing loss; temporal coding.


Figures

Figure 1.
Figure 1.
Illustration of the detrimental effects of real-world noise (restaurant chatter) on the representation of a target sound at the level of the auditory nerve (AN). A, Long-term spectrum of noise recorded from a crowded restaurant showing the typical 1/f magnitude characteristic. B, Representation of a target vowel (pitch, 140 Hz) simulated using a phenomenological model of the AN (Zilany et al., 2014) in quiet (top) and with additive restaurant chatter (bottom) for a short analysis time window across fibers with different characteristic frequencies (CFs). Although strong modulations are apparent in both cases, the latter shows more irregularities. C, Distribution of the SNR across time-frequency “cells” (50 ms time windows for each cochlear channel). Within a given time-frequency cell, the SNR was defined as the ratio of the power in the modulation spectrum of the AN response at the target pitch (140 Hz) relative to the background. As more noise is added, the AN representation shifts from representing target modulations robustly (>20 dB SNR) to representing mostly noise (modulation SNR growing progressively negative). D, Proportion of time-frequency “cells” dominated by the target (i.e., having an SNR of >3 dB). Although ∼95% of the cells represent the target modulations in quiet (dotted line), when the noise level matches the signal level (solid vertical line), only ∼15% of the “cells” represent the target. Thus, although most time windows and most cochlear channels represent the target in quiet, maskers reduce both the temporal modulations and the availability of “off-frequency” channels.
Figure 2.
Figure 2.
Effects on population distribution of cochlear nerve fibers with low and high spontaneous discharge rates in following noise exposure (left; Furman et al., 2013) and aging (right; Schmiedt et al., 1996). Whereas the split of low- to high-SR fiber counts is roughly 50/50 in both control groups (unexposed guinea pigs and young gerbils, respectively), both noise exposure and aging appear to lead to a selective (but not necessarily exclusive) neuropathy of low-SR ANFs. As argued by Bharadwaj et al. (2014), this selectivity may be potentially leveraged to design stimuli that are sensitive to suprathreshold temporal coding deficits arising due to neuropathy. Note that CF stands for fiber characteristic frequencies.
Figure 3.
Figure 3.
Objective and behavioral measures of cochlear hair cell function. A, DPOAE input–output curves (f2 = 4 kHz) for the NH cohort and two subjects with elevated thresholds. DPOAE thresholds are elevated for subjects with hearing loss, affirming that the measure is sensitive to cochlear mechanical deficits. B, Forward-masking tuning curves at 10 dB SL for the NH cohort. C, Comparison of audiometric thresholds and modulation thresholds across individuals. There is no significant correlation.
Figure 4.
Figure 4.
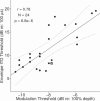
Relationship between monaural (modulation thresholds) and binaural (envelope ITD thresholds) measures of temporal sensitivity. The subject denoted with the star symbol was unavailable for the EFR measures. A considerable portion of the variance in the binaural measure can be accounted for by differences in the “monaural” measure.
Figure 5.
Figure 5.
Results of subcortical steady-state response measures. A, Illustration of the stimulus used for EFR measures. The use of off-frequency noise attenuates contributions of tonotopic regions away from 4 kHz. B, Large individual differences are observed in the EFR, particularly at lower modulation depths. Whereas some individuals show strong responses even for shallow modulations, others show a rapid decline in the early neural representation of envelopes as the modulation depth decreases.
Figure 6.
Figure 6.
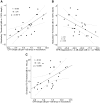
Relationship between EFR and behavioral measures of temporal sensitivity. A, AM thresholds versus EFR slope. The rate at which the EFR drops with decreasing modulation correlates strongly with perceptual modulation sensitivity. B, AM thresholds versus absolute EFR magnitude at −4 dB modulation depth (the shallowest depth at which 90% of the subjects showed a clear EFR response distinguishable from the noise floor). Although the absolute EFR magnitude at a given modulation depth correlates with perceptual ability, the correlation is not as strong as the correlation between EFR slope and perception. C, Envelope ITD threshold versus EFR slope. Subcortical temporal coding fidelity as measured by EFR slope also can explain a considerable amount of the variance in envelope ITD thresholds. The subject denoted by the triangle symbol in A and B was unavailable for envelope ITD threshold measurement, and the subject denoted by the square symbol in C was unavailable for modulation threshold measurement.
Figure 7.
Figure 7.
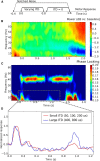
Results from cortical EEG measures of envelope ITD sensitivity. A, Stimulus sequence. Subjects were asked to indicate if sounds jumped from left to center or right to center. B, Induced power relative to baseline. C, Intertrial phase locking reveals low-frequency responses to the onset of AM tones in addition to showing a sustained response at the modulation frequency (40 Hz). D, A closer look at the low-frequency power in onset responses to the two tones (averaged over frequencies below 20 Hz) showing envelope ITD–specific adaptation.
Figure 8.
Figure 8.
ITD-based attention. A, A schematic illustration of the sequence of events constituting the task. Each trial began with the subject visually fixated on the center of the screen. A visual cue (left or right arrow) appeared 2 s before the onset of the sounds, identifying the direction of the target stream (left or right, based on ITDs). Two simultaneous sequences of digits spoken by the same speaker and monotonized to the same pitch were then presented. Following the digit sequences, a visual response circle cued the subject to respond and indicate the three digits in the target sequence using button presses. Finally, feedback was given to the subject as follows: a green circle, indicating that all three digits were identified correctly; a blue circle, indicating that two of the three digits were identified correctly; or a red cross, indicating that fewer than two response digits matched the correct target sequence. B, Performance as a function of ITD. Large individual differences are evident. The upper and lower hinges correspond to the first and third quartiles (the 25th and 75th percentiles). The upper whisker extends from the hinge to the highest value that is within 1.5 * IQR of the hinge, where IQR is the inter-quartile range, or distance between the first and third quartiles. The lower whisker extends from the hinge to the lowest value within 1.5 * IQR of the hinge. Data beyond the end of the whiskers are outliers and plotted as individual points. The drop in performance with ITD indicates that sensory coding limitations, perhaps related to source separability, dominate performance.

References

    1. Backus BC, Guinan JJ., Jr Measurement of the distribution of medial olivocochlear acoustic reflex strengths across normal-hearing individuals via otoacoustic emissions. J Assoc Res Otolaryngol. 2007;8:484–496. doi: 10.1007/s10162-007-0100-0. - DOI - PMC - PubMed
    1. Benjamini Y, Hochberg Y. Controlling the false discovery rate: a practical and powerful approach to multiple testing. J Royal Stat Soc Series B Stat Methodol. 1995;57:289–300.
    1. Bernstein LR, Trahiotis C. Enhancing sensitivity to interaural delays at high frequencies by using “transposed stimuli.”. J Acoust Soc Am. 2002;112:1026–1036. doi: 10.1121/1.1497620. - DOI - PubMed
    1. Bernstein LR, Trahiotis C. Discrimination of interaural temporal disparities conveyed by high-frequency sinusoidally amplitude-modulated tones and high-frequency transposed tones: effects of spectrally flanking noises. J Acoust Soc Am. 2008;124:3088–3094. doi: 10.1121/1.2980523. - DOI - PMC - PubMed
    1. Bharadwaj HM, Shinn-Cunningham BG. Rapid acquisition of auditory subcortical steady-state responses using multichannel recordings. Clin Neurophysiol. 2014;125:1878–1888. doi: 10.1016/j.clinph.2014.01.011. - DOI - PMC - PubMed

Publication types

LinkOut - more resources