Flexible regression models over river networks
- PMID: 25653460
- PMCID: PMC4303988
- DOI: 10.1111/rssc.12024
Flexible regression models over river networks
Abstract
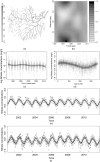
Many statistical models are available for spatial data but the vast majority of these assume that spatial separation can be measured by Euclidean distance. Data which are collected over river networks constitute a notable and commonly occurring exception, where distance must be measured along complex paths and, in addition, account must be taken of the relative flows of water into and out of confluences. Suitable models for this type of data have been constructed based on covariance functions. The aim of the paper is to place the focus on underlying spatial trends by adopting a regression formulation and using methods which allow smooth but flexible patterns. Specifically, kernel methods and penalized splines are investigated, with the latter proving more suitable from both computational and modelling perspectives. In addition to their use in a purely spatial setting, penalized splines also offer a convenient route to the construction of spatiotemporal models, where data are available over time as well as over space. Models which include main effects and spatiotemporal interactions, as well as seasonal terms and interactions, are constructed for data on nitrate pollution in the River Tweed. The results give valuable insight into the changes in water quality in both space and time.
Keywords: Flexible regression; Kernels; Network; Penalized splines; Smoothing; Spatial separation; Spatiotemporal models; Water quality.
Figures


 ,
,  ), flows (
 ,
,  ) and the corresponding outgoing versions (
 ,
,  )
)


References
-
- Akita Y, Carter G, Serre ML. Spatiotemporal nonattainment assessment of surface water tetrachloroethylene in New Jersey. J. Environ. Qual. 2007;36:508–520. - PubMed
-
- de Boor C. A Practical Guide to Splines. New York: Springer; 1978.
-
- Bowman A, Azzalini A. Applied Smoothing Techniques for Data Analysis. Oxford: Oxford University Press; 1997.
-
- Bowman A, Crawford E, Alexander G, Bowman RW. rpanel: simple interactive controls for r functions using the tcltk package. J. Statist. Softwr. 2007;17:1–18.
-
- Bowman AW, Giannitrapani M, Scott EM. Spatiotemporal smoothing and sulphur dioxide trends over Europe. Appl. Statist. 2009;58:737–752.
Publication types
LinkOut - more resources
Full Text Sources
Other Literature Sources
