

Aberrant spontaneous low-frequency brain activity in male patients with severe obstructive sleep apnea revealed by resting-state functional MRI
- PMID: 25653530
- PMCID: PMC4311758
- DOI: 10.2147/NDT.S73730
Aberrant spontaneous low-frequency brain activity in male patients with severe obstructive sleep apnea revealed by resting-state functional MRI
Abstract
Background: The majority of previous neuroimaging studies have demonstrated both structural and functional abnormalities in obstructive sleep apnea (OSA). However, few studies have focused on the regional intensity of spontaneous fluctuations during the resting state and the relationship between the abnormal properties and the behavioral performances. In the present study, we employed the amplitude of low-frequency fluctuation (ALFF) method to explore the local features of spontaneous brain activity in OSA patients (OSAs).
Methods: Twenty-five untreated male severe OSAs and 25 age-matched and years-of-education-matched male good sleepers (GSs) were included in this study. The ALFF method was used to assess the local features of spontaneous brain activity. The mean signal values of the altered ALFF areas were analyzed with receiver operating characteristic curve. Partial correlation analysis was used to explore the relationship between the observed mean ALFF values of the different areas and the behavioral performances.
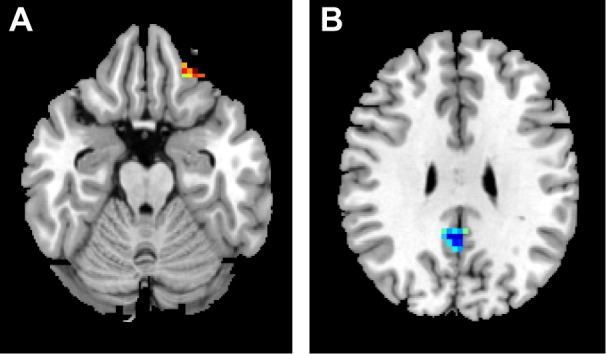
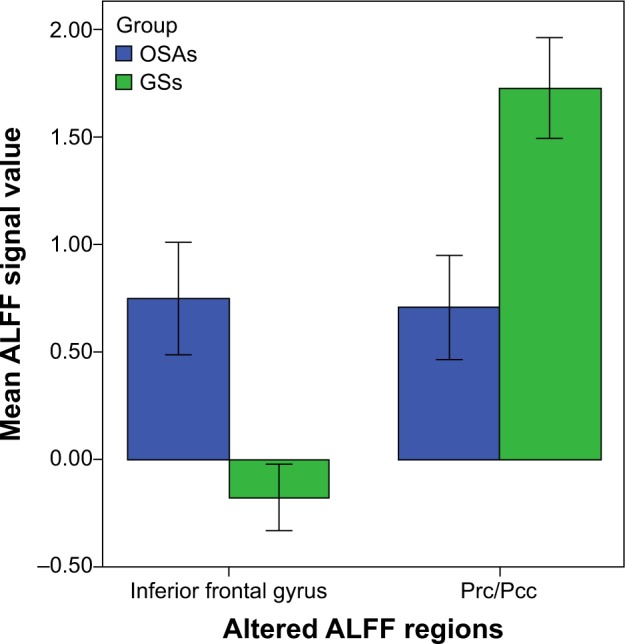
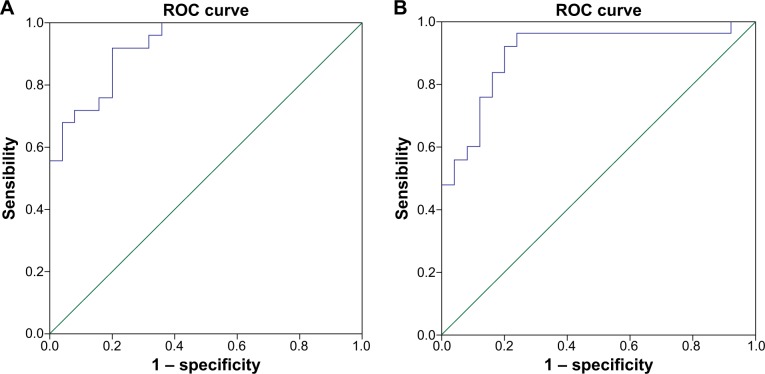
Results: Compared with GSs, OSAs had significantly higher scores for body mass index, apnea-hypopnea index, arterial oxygen saturation <90%, arousal index, and Epworth Sleepiness Scale (ESS) score; furthermore, OSAs had significantly lower scores for rapid eye movement sleep and in the Montreal Cognitive Assessment (MoCA). Compared with GSs, OSAs showed significant lower-ALFF areas in the cluster of the right precuneus and bilateral posterior cingulate gyrus, as well as a higher-ALFF area in the left inferior frontal gyrus. The area under the curve values of the lower- and higher-ALFF areas were 0.90 and 0.93, respectively. Further diagnostic analysis exhibited that the sensibility and specificity of the two clusters were 80% and 92%, respectively. The mean signal value of the lower-ALFF cluster displayed significant positive correlations with lowest oxygen saturation (r=0.447, P=0.025) and MoCA score (r =0.405, P=0.045).
Conclusion: OSAs may involve in a dysfunction in the default mode network and an adaptive compensatory response in the frontal lobe, which reflect the underlying pathophysiology of cognitive impairment.
Keywords: amplitude of low-frequency fluctuation; blood oxygen-level-dependent; functional magnetic resonance imaging; obstructive sleep apnea; resting state; spontaneous activity.
Figures
References
-
- Sajkov D, McEvoy RD. Obstructive sleep apnea and pulmonary hypertension. Prog Cardiovasc Dis. 2009;51(5):363–370. - PubMed
-
- Flemons WW, Remmers JE, Gillis AM. Sleep apnea and cardiac arrhythmias: Is there a relationship? Am Rev Respir Dis. 1993;148(3):618–621. - PubMed
-
- Munoz R, Duran-Cantolla J, Martínez-Vila E, et al. Severe sleep apnea and risk of ischemic stroke in the elderly. Stroke. 2006;37(9):2317–2321. - PubMed
LinkOut - more resources
Full Text Sources
Miscellaneous
