. 2015 Jan 29;13(1):2.
doi: 10.1186/s12953-014-0059-9. eCollection 2015.

Proteomics analysis of urine reveals acute phase response proteins as candidate diagnostic biomarkers for prostate cancer

Affiliations

Proteomics analysis of urine reveals acute phase response proteins as candidate diagnostic biomarkers for prostate cancer

Katarina Davalieva et al. Proteome Sci. .

Abstract

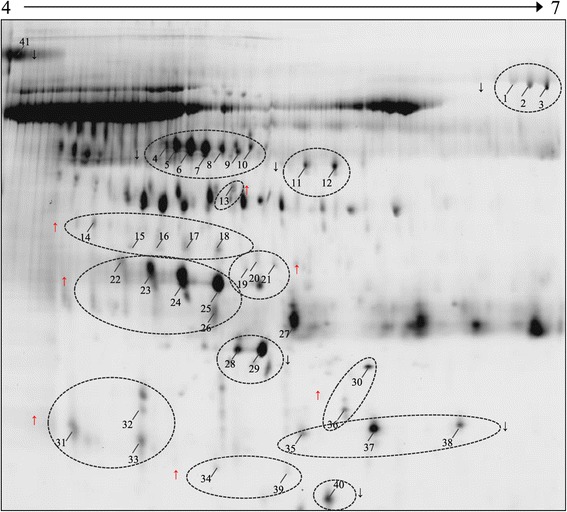
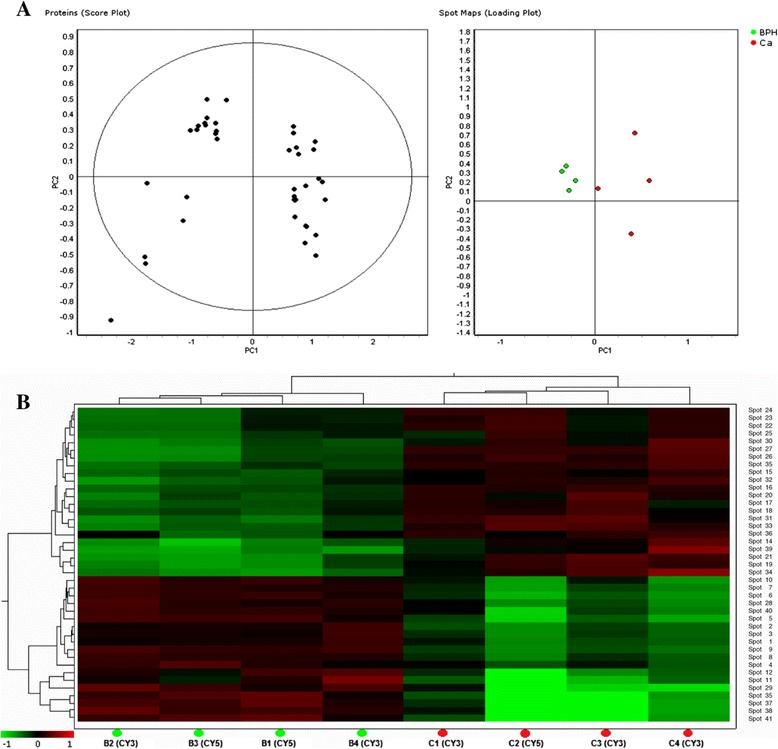
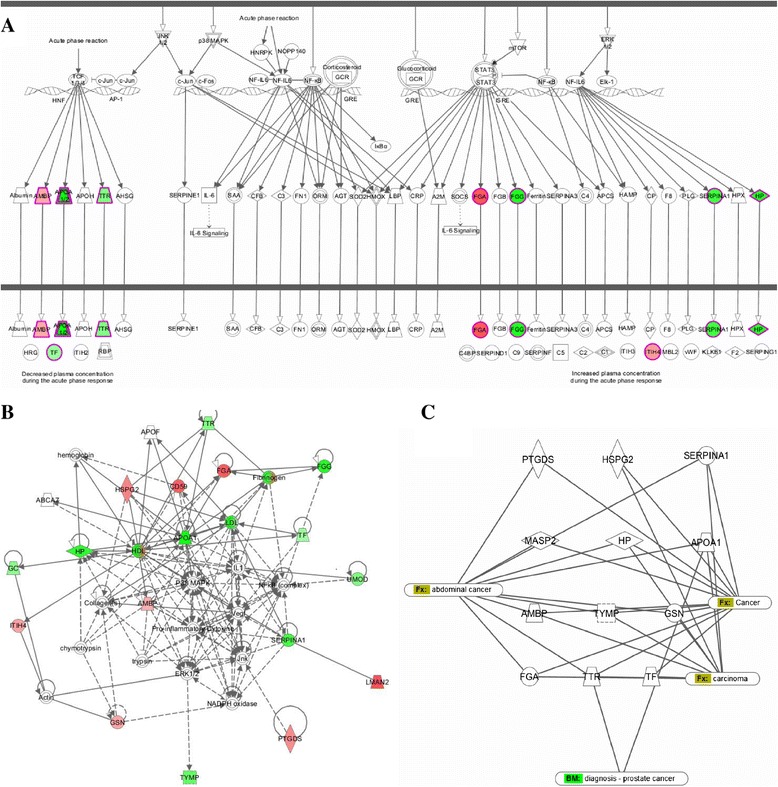
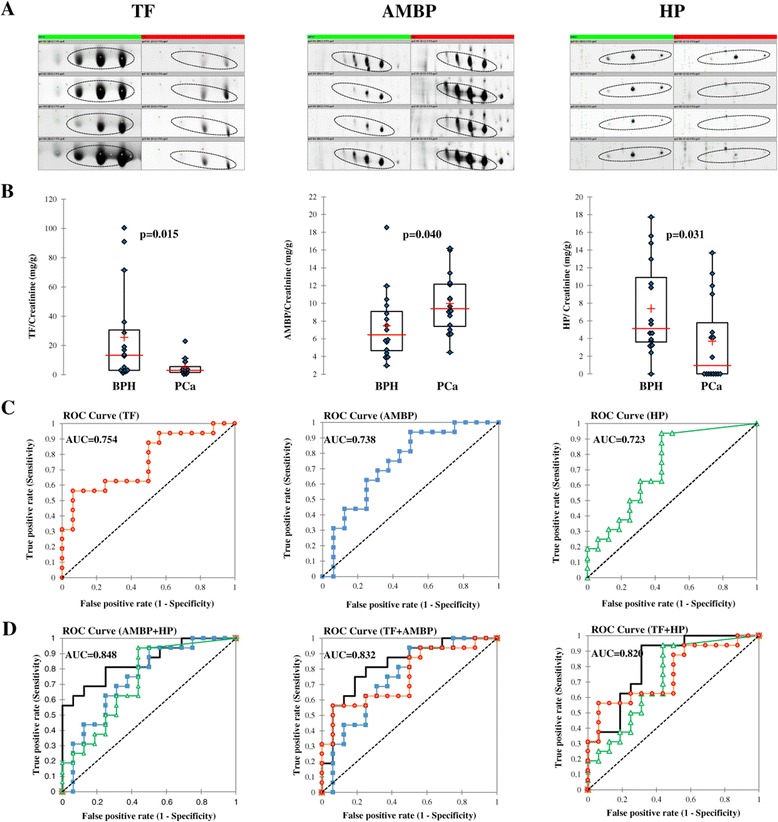
Despite the overall success of prostate specific antigen (PSA) in screening and detection of prostate cancer (PCa), its use has been limited due to the lack of specificity. The principal driving goal currently within PCa research is to identify non-invasive biomarker(s) for early detection of aggressive tumors with greater sensitivity and specificity than PSA. In this study, we focused on identification of non-invasive biomarkers in urine with higher specificity than PSA. We tested urine samples from PCa and benign prostatic hyperplasia (BPH) patients by 2-D DIGE coupled with MS and bioinformatics analysis. Statistically significant (p < 0.05), 1.8 fold variation or more in abundance, showed 41 spots, corresponding to 23 proteins. The Ingenuity Pathway Analysis showed significant association with the Acute Phase Response Signaling pathway. Nine proteins with differential abundances were included in this pathway: AMBP, APOA1, FGA, FGG, HP, ITIH4, SERPINA1, TF and TTR. The expression pattern of 4 acute phase response proteins differed from the defined expression in the canonical pathway. The urine levels of TF, AMPB and HP were measured by immunoturbidimetry in an independent validation set. The concentration of AMPB in urine was significantly higher in PCa while levels of TF and HP were opposite (p < 0.05). The AUC for the individual proteins ranged from 0.723 to 0.754. The combination of HP and AMBP yielded the highest accuracy (AUC = 0.848), greater than PSA. The proposed biomarker set is quickly quantifiable and economical with potential to improve the sensitivity and specificity of PCa detection.

Keywords: 2-D DIGE; Benign prostate hyperplasia; MS; Non-invasive biomarkers; Prostate cancer; Urine analysis.


Figures

Figure 1
Figure 1
Representative 2-D map of the urine proteome obtained by using IEF on pH 4–7 IPG strip and 2-D gel electrophoresis on 12.5% SDS-PAGE. All proteins with differential abundance between studied groups are marked with numbered arrows. Details of these proteins identified by MALDI MS are tabulated in Table 1. Proteins with increased abundance in PCa are marked with red arrows.
Figure 2
Figure 2
Principal component analysis and hierarchical cluster analysis of the proteins with differential abundance. (A) Scatter plots of the principal component analysis where green dots represent urine samples from BPH patients and red dots samples from PCa patients. (B) The hierarchical clustering result: higher abundance in PCa group is coloured in red, the lower ones in green. Column descriptors indicate the 4 samples per group (B = BPH; C = PCa) and the labeling dye, while the row descriptors indicate proteins with their spot numbers (given in Table 1). The dendrograms represent the distances between the clusters.
Figure 3
Figure 3
Pathways and networks associated with proteins with differential abundance according to IPA. (A) The top canonical pathway significantly associated with the differentially expressed proteins - Acute Phase Response Signaling (p = 6,99 e−14). (B) Highest ranked protein network of functional associations between 23 proteins with differential abundance - Cancer, Organism injury and abnormalities and Gastrointestinal Disease. Most of the proteins with differential abundance are closely connected in the network through three major nodes: P38 MARK, Pro-inflamatory cytokine and ERK1/2. The network is graphically displayed with proteins as nodes and the biological relationships between the nodes as lines. The color of the shapes indicates the degree of over-expression (red) or under-expression (green) of the corresponding protein in PCa compared to BPH samples. Direct connection between molecules is represented by a solid line and indirect connection by broken line. The length of a line reflects published evidence supporting the node-to-node relationship concerned. (C) Selected subset of proteins with differential abundance associated with cancer in humans or cancer cell lines.
Figure 4
Figure 4
Validation of candidate biomarkers for the diagnosis of PCa. (A) 2-DE profiles of TF, AMBP and HP abundance in independent urine samples from BPH and PCa patients obtained by 2-D DIGE. Proteins with differential abundance were represented by clusters of 3–4 spots, highlighted with oval lines. Four gels corresponding to samples from each group were shown. (B) TF, AMBP and HP levels in urine of PCa and BPH patients, expressed as relative ratio to urine creatinine and obtained by immunoturbidimetry. AMBP level in PCa was significantly higher than that in BPH while TF and HP levels in PCa were significantly lower than in BPH (Mann–Whitney U-test, P < 0.05). In the combined dot/box plot graphs, concentration data (blue diamond), median (−), 25th and 75th percentiles and mean (+) are shown. (C) Urinary TF, AMBP and HP distinguish PCa on independent series of urine samples from patients with PCa and BPH. The optimal cutoffs for the proteins were: 12.81 mg TF/g creatinine (93.8% specificity, 56.3% sensitivity); 6.51 mg AMBP/g creatinine (50.0% specificity, 93.8% sensitivity); 2.40 mg HP/g creatinine (56.3% specificity, 93.8% sensitivity). ROC curves were based on series of 32 urine samples. (D) The diagnostic accuracy of TF, AMBP and HP combinations using logistic regression model. The combination AMBP and HP yielded highest diagnostic accuracy (AUC = 0.848).

Similar articles

Cited by

References

    1. Catalona WJ, Smith DS, Ratliff TL, Dodds KM, Coplen DE, Yuan JJ, et al. Measurement of prostate-specific antigen in serum as a screening test for prostate cancer. N Engl J Med. 1991;324(17):1156–1161. doi: 10.1056/NEJM199104253241702. - DOI - PubMed
    1. Oberaigner W, Horninger W, Klocker H, Schonitzer D, Stuhlinger W, Bartsch G. Reduction of prostate cancer mortality in Tyrol, Austria, after introduction of prostate-specific antigen testing. Am J Epidemiol. 2006;164(4):376–384. doi: 10.1093/aje/kwj213. - DOI - PubMed
    1. Stamey TA, Yang N, Hay AR, McNeal JE, Freiha FS, Redwine E. Prostate-specific antigen as a serum marker for adenocarcinoma of the prostate. N Engl J Med. 1987;317(15):909–916. doi: 10.1056/NEJM198710083171501. - DOI - PubMed
    1. Nadler RB, Humphrey PA, Smith DS, Catalona WJ, Ratliff TL. Effect of inflammation and benign prostatic hyperplasia on elevated serum prostate specific antigen levels. The Journal of urology. 1995;154(2 Pt 1):407–413. doi: 10.1016/S0022-5347(01)67064-2. - DOI - PubMed
    1. Thompson IM, Pauler DK, Goodman PJ, Tangen CM, Lucia MS, Parnes HL, et al. Prevalence of prostate cancer among men with a prostate-specific antigen level < or =4.0 ng per milliliter. N Engl J Med. 2004;350(22):2239–2246. doi: 10.1056/NEJMoa031918. - DOI - PubMed