. 2015 Jan 21:8:222.
doi: 10.3389/fnsys.2014.00222. eCollection 2014.

Decrease in gamma-band activity tracks sequence learning

Affiliations

Decrease in gamma-band activity tracks sequence learning

Radhika Madhavan et al. Front Syst Neurosci. .

Abstract

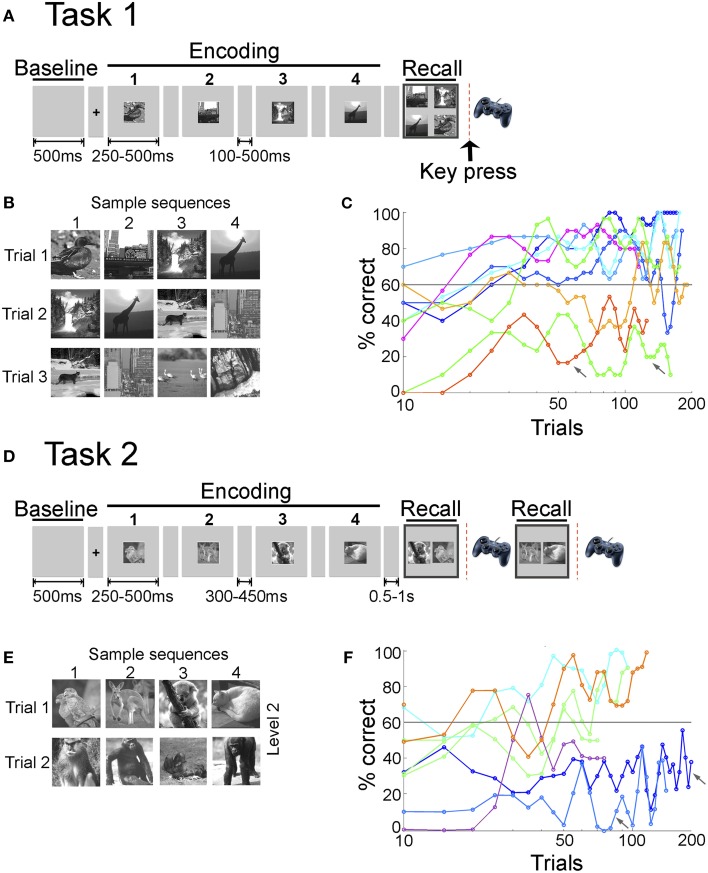
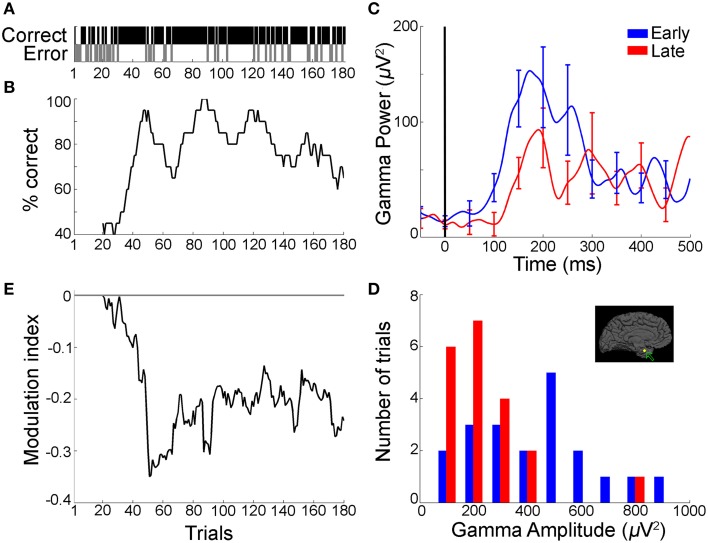
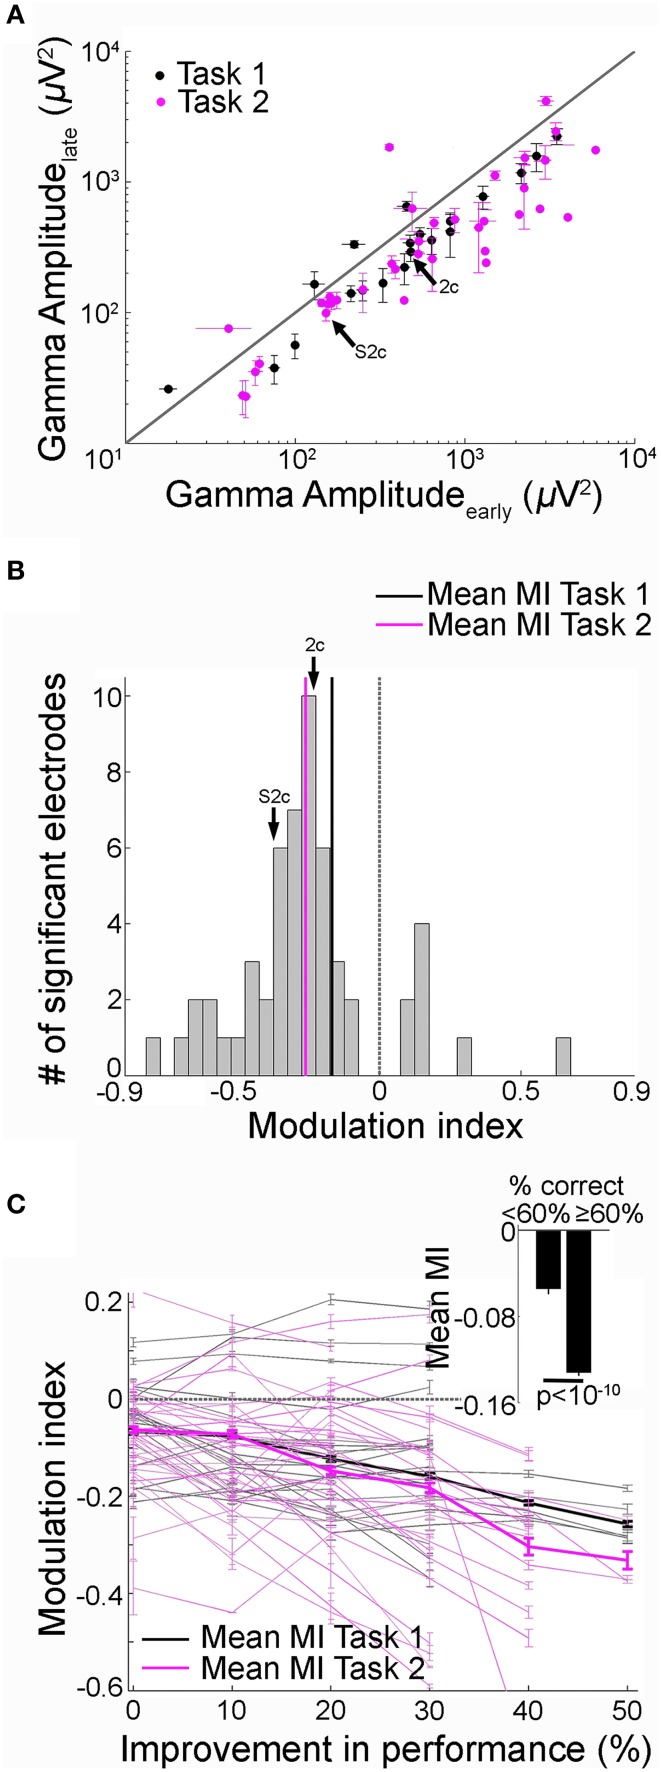
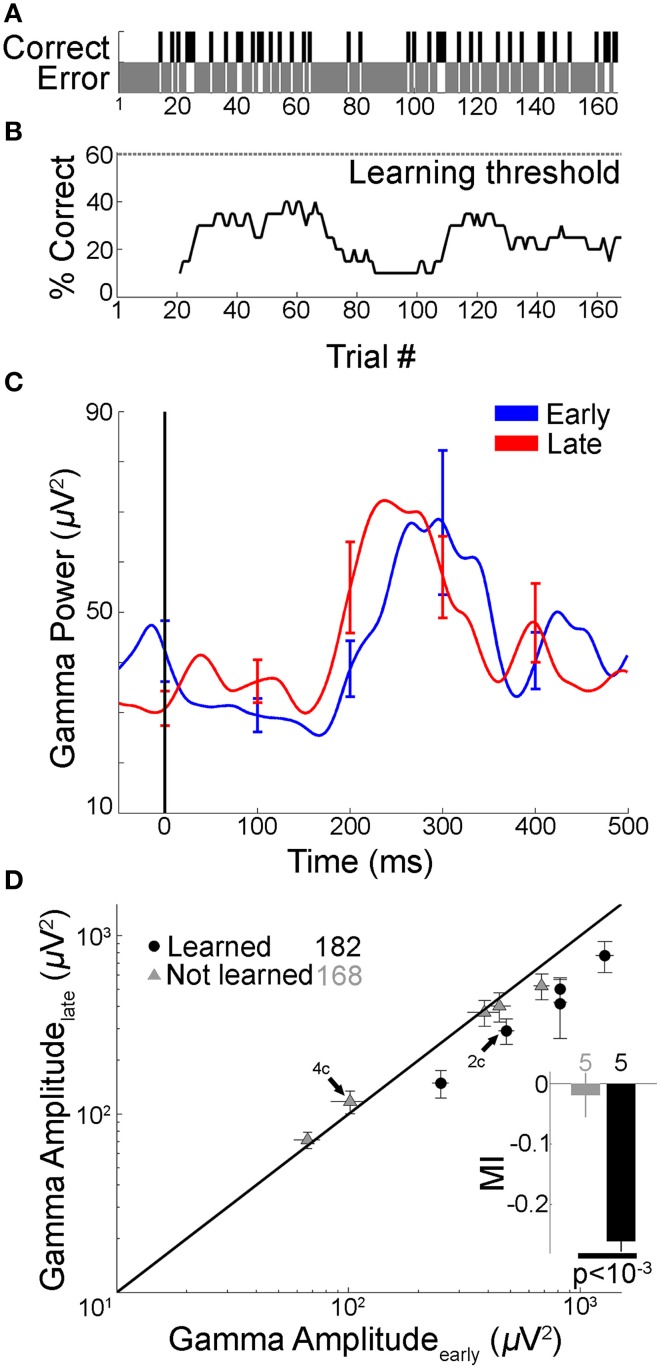
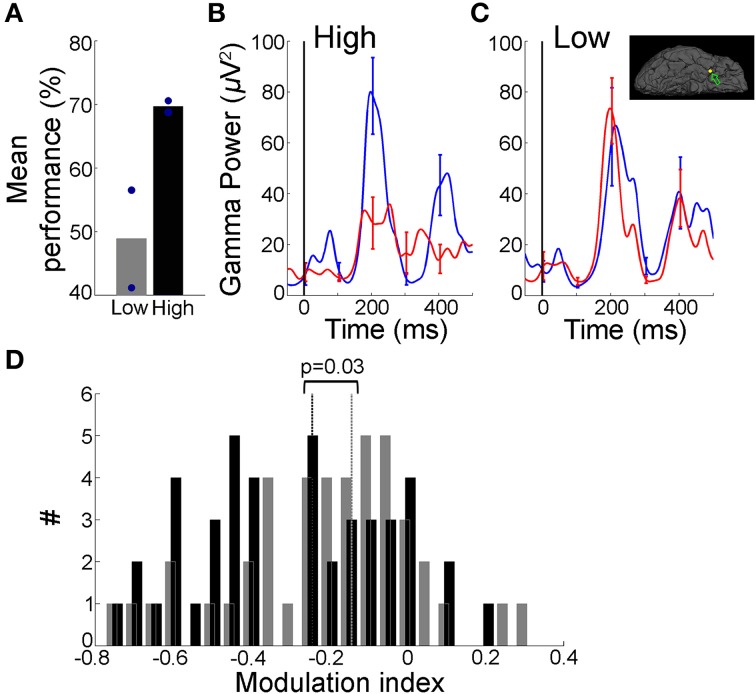
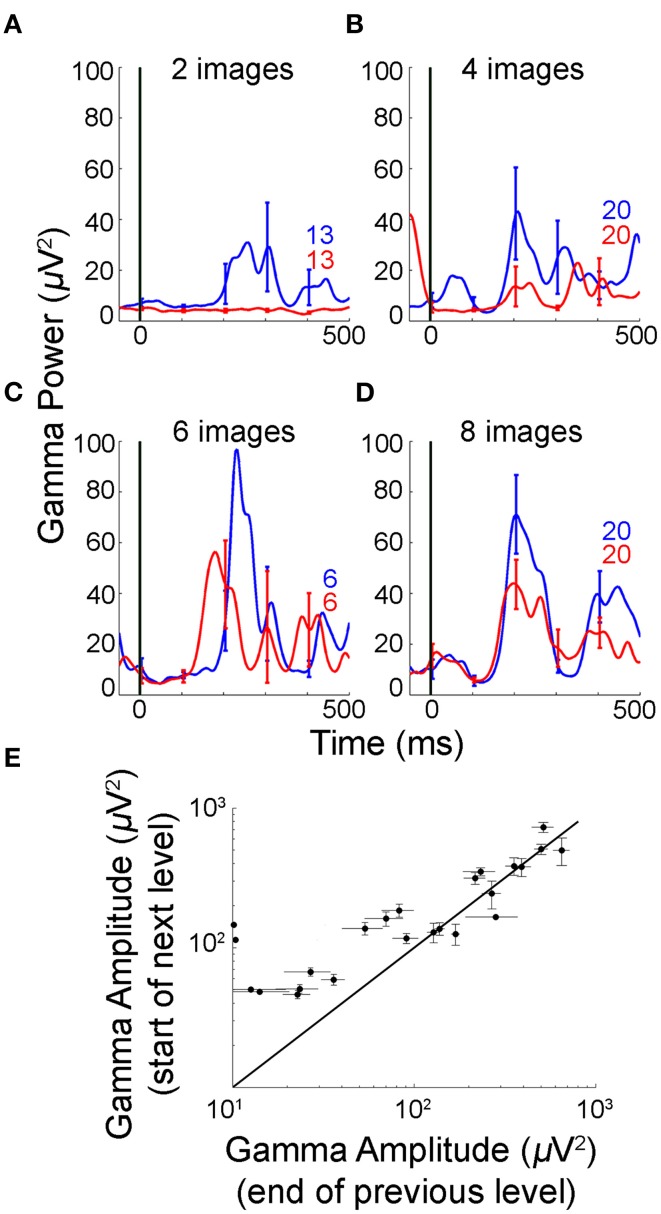
Learning novel sequences constitutes an example of declarative memory formation, involving conscious recall of temporal events. Performance in sequence learning tasks improves with repetition and involves forming temporal associations over scales of seconds to minutes. To further understand the neural circuits underlying declarative sequence learning over trials, we tracked changes in intracranial field potentials (IFPs) recorded from 1142 electrodes implanted throughout temporal and frontal cortical areas in 14 human subjects, while they learned the temporal-order of multiple sequences of images over trials through repeated recall. We observed an increase in power in the gamma frequency band (30-100 Hz) in the recall phase, particularly in areas within the temporal lobe including the parahippocampal gyrus. The degree of this gamma power enhancement decreased over trials with improved sequence recall. Modulation of gamma power was directly correlated with the improvement in recall performance. When presenting new sequences, gamma power was reset to high values and decreased again after learning. These observations suggest that signals in the gamma frequency band may play a more prominent role during the early steps of the learning process rather than during the maintenance of memory traces.

Keywords: field potentials; gamma frequency oscillations; human neurophysiology; intracranial recordings; memory; sequence learning.


Figures

Figure 1
Figure 1
Sequence encoding tasks and learning behavior. (A) In Task 1, each trial started with a fixation screen (100 or 500 ms) followed by a sequence of four images, each one presented for either 250 or 500 ms, referred to as the encoding phase. After a short delay (100 or 500 ms), the four images were presented together on the screen in the recall phase. The subjects had to report the order of the four images using a gamepad (key press) (Materials and Methods). (B) Sample images presented during Task 1. Each sequence consisted of four images from a pool of eight images per session. Images were always presented in the same order and three or five overlapping sequences were shown per session. (C) Behavioral performance for Task 1. Performance in a given trial was considered correct if the subject reported the right order for all four images in the sequence (out of the 24 possible combinations in which four buttons can be pressed, only one of them was correct). Here we show the average performance (percentage of correct trials, y-axis) for each subject (eight subjects) and session in bins of 10 trials (x-axis, note the logarithmic scale). Colors indicate different subjects; for one subject there are two separate lines, indicating different sessions (green line). The gray line indicates the learning criterion of 60% correct (Materials and Methods). Arrows indicate sessions in which the subjects' performance did not satisfy the learning criterion. On average, subjects needed 28 ± 11 [mean ± standard deviation (SD)] trials to reach the learning criterion in Task 1. (D) In Task 2, each trial started with a fixation screen (300 or 450 ms) followed by a sequence of 2, 4, 6, or 8 images (levels 1–4 respectively, Materials and Methods). During the recall phase, two of the images were shown and subjects had to indicate which image appeared earlier in the sequence. For sequence lengths >2, recall was sequentially tested for two pairs of images randomly chosen from all possible image pairs in the sequence. (E) Sample images presented during Task 2 (here, level 2, length = 4). Images were always presented in the same order and five or six non-overlapping sequences were shown per level. Each level consisted of different images. (F) Behavioral performance for Task 2. Performance in a given trial was considered correct if the subject reported the correct order for all pairs presented in the recall phase. Here we show the average performance (percentage of correct trials, y-axis) for each subject (six subjects) and level in bins of 10 trials (x-axis, note the logarithmic scale). Colors indicate different subjects; for one subject there are two separate lines, indicating different levels (green line). While subjects participated in more than one level, only levels with more than 30 trials are included in this graph. Arrows indicate levels in which the subjects' performance did not satisfy the learning criterion. On average, subjects needed 25 ± 22 trials to reach the learning criterion in Task 2.
Figure 2
Figure 2
Gamma frequency band power during the recall phase decreased with improved sequence learning over trials (example from Task 1). (A) Behavioral profile of a representative subject during sequence learning in Task 1 showing performance (correct, black; error, gray) at each trial (n = 182 trials). (B) Associated learning curve computed by using a sliding window of 20 trials stepped by one trial. (C) Mean gamma frequency band power (30–100 Hz) averaged over the first (“early,” blue) and last (“late,” red) 20 trials in the session, for an electrode in the left parahippocampal gyrus (Talairach coordinates: −19.2, −4.6, −30.2; inset in part d depicts electrode position). Data are aligned to choice screen presentation at t = 0. Error bars represent SEM and are shown every 50 ms for clarity. (D) Distribution of peak-to-peak gamma frequency band amplitudes (Gamma-band amplitude = max [Gamma-band power]—min[Gamma-band power] in the [0:500] ms window from choice screen onset) during early (blue) and late (red) trials. There was a significant reduction in gamma frequency band amplitudes in the late trials compared to the early trials (p = 0.003, rank sum test). There was no significant trend in the distribution of peak-to-peak broadband signals between early and late trials in the same electrode (p = 0.14, rank sum test). (E) Modulation index (MI) curve (difference between the mean gamma frequency band amplitudes in the early trials and subsequent trials, Materials and Methods), computed by using 20-trial sliding bins stepped by one trial, showing a decrease in gamma frequency band amplitude concomitant with the subject's performance improvement shown in b (mean MI: −0.19 ± 0.006 [mean ± SEM]). The horizontal line represents MI = 0 (i.e., no change in gamma frequency band amplitude).
Figure 3
Figure 3
Decrease in recall phase gamma frequency band amplitude over trials was directly correlated with learning. (A) Gamma frequency band amplitudes in the late (y-axis) vs. early (x-axis) trials during the recall phase (black = Task 1; Pink = Task 2). Data from 51 electrodes that showed significant changes in gamma-band amplitudes with learning from 11 subjects that reached the behavioral learning criterion (Figure 1, Materials and Methods). The arrow points to the example electrode shown in Figure 2 and Supplementary Figure 2. Error bars represent SEM. The diagonal represents no change between early and late trials. (B) Distribution of modulation index (MI) values between early and late trials during the recall phase (both tasks combined). The MI values were predominantly negative (Task 1, 20 electrodes, −0.17 ± 0.04 [mean ± SEM], Task 2, 31 electrodes, −0.26 ± 0.02). The arrow points to the MI value for the example electrode in Figure 2 and Supplementary Figure 2. Dotted vertical line represents MI = 0. (C) MI as a function of behavioral performance improvement. Performance improvement along the x-axis was calculated as change in the percentage correct compared to the first block of 20 trials. Each point indicates the average MI for a given value of performance improvement. MI values and performance were computed by using a 20-trial sliding bin stepped by one trial. Each gray solid line represents an electrode from Task 1 and the thin pink line represents an electrode from Task 2; the thick lines show the average across electrodes. The dotted line indicates MI = 0. The Pearson correlation coefficient (r) between MI and behavioral performance improvement across 51 electrodes was −0.35 (p < 10−5). The range of MI values were restricted to (−0.6 0.2) for visualization. MI values outside this range from 2/51 electrodes are not shown. Mean MI values for low (<60%) and high (≥ 60%) performance 20-trial bins are shown in the inset (p < 10−10, t-test). Error bars denote SEM.
Figure 4
Figure 4
Gamma frequency band amplitude remained unchanged if subject did not learn. In four subjects that did not learn the tasks, <1% of the electrodes showed changes in gamma band amplitude with learning. In order to directly compare changes in gamma-band amplitude with behavioral performance in the same electrodes we report results from one example subject that participated in two sessions of Task 1: in one of those sessions the learning criterion was not reached. (A,B) Performance for a subject who participated in two sessions of Task 1 (green lines in Figure 1C). In one session, the subject reached the learning criterion (maximum performance was >90%, shown in Figures 2A,B). In the other session, shown here, the subject did not reach the learning criterion (maximum performance <40%). The format is the same as in Figures 2A,B. (C) Mean gamma frequency band power averaged over the early and late trial blocks (each 20 trials), for the same electrode in Figure 2C, shown here during the session where the learning criterion was not reached. Figure format is the same as Figure 2C. The gamma frequency band amplitude was not significantly different between early and late trials (p = 0.32, rank sum test). (D) Five out of 69 electrodes in this subject showed significant changes in gamma frequency band amplitudes (p < 0.01) between early and late trials in the session where there was learning compared to zero electrodes in the session where there was no learning. Here we compare the gamma frequency band amplitudes during the recall phase for the same five electrodes between the “not learned” session (gray triangles, 168 trials) and the “learned” session (black circles, 182 trials) in the late (y-axis) vs. early trials (x-axis). Arrows point to the example electrode in Figures 2C, 4C. Inset shows the average MI in “not learned” and “learned” blocks (p < 10−3, rank sum test).
Figure 5
Figure 5
Decrease in gamma band activity was restricted to learned sequences. (A) Performance across different sequences within a single level for an example subject that participated in Task 2. This subject learned five, eight-image long sequences during the course of this level. Behavioral performance for each sequence was calculated separately and sequences were ranked by performance (“low”/”high” = two sequences with lowest/highest mean percentage correct; circles indicate individual sequences). (B,C) Mean gamma frequency band power averaged over the early (blue) and late (red) trials (each 15 trials), for “High” sequences (B) and “Low” sequences (C) for an electrode in the right temporal pole (Talairach coordinates: 28.6, 3.7, −37.0; inset in (C) depicts electrode position). Figure format is the same as Figure 2C. The gamma frequency band amplitude was significantly different between early and late trials in (C) (p = 0.02, rank sum test, MI = −0.11) but not in (C) (p = 0.38, rank sum test, MI = 0.003). (D) Distribution of Modulation index values for sequences showing “High” (black) and “Low” (gray) behavioral performance across four subjects that successfully learned Task 2 and with ≥ 30 trials in the “High”/“Low” categories (dotted lines indicate median values). There was a significant difference in the MI values (p = 0.03, rank sum test). The mean performance was 88 ± 10% for “High” and 58 ± 16% for “Low” sequences. Data from 22/31 electrodes that showed significant differences between early and late trials in Task 2.
Figure 6
Figure 6
Gamma frequency band amplitude was reset at the start of each level in Task 2. (A–D) Mean gamma frequency band power averaged over early and late trials in multiple levels for the same electrode in Figures 5B,C (numbers of trials shown in each subplot). The subject participated in a single experimental session consisting of four levels of increasing sequence length. The interval between levels ranged from 8 to 183 s. The maximum performance in any bin of 10 trials was 100% in level 1 (27 trials), 100% in level 2 (96 trials), 80% in level 3 (13 trials), and 70% in level 4 (80 trials). The mean gamma frequency band amplitude decreased significantly between “early” and “late” trials within levels 1, 2, and 4 as the sequences were learned (p < 0.01, rank sum test). Level 3 had a small number of trials since the subject learned the sequences rapidly and significance was not reached even though the trend is the same as in the other levels. The mean gamma frequency band amplitude did not continue to decrease across levels but instead was reset to a new and higher value. (E) Gamma frequency band amplitudes in the last 20 trials for the previous level (x-axis) vs. first 20 trials in the next level (y-axis) during the recall phase This figure includes N = 3 out of four subjects that reached the learning criterion in Task 2 and participated in at least two levels with ≥ 20 trials. The diagonal represents no change in gamma frequency band amplitudes between the last 20 trials of the preceding level and the first 20 trials in the next level. Error bars represent SEM.

Similar articles

Cited by

References

    1. Akay M. (1998). Time Frequency and Wavelets in Biomedical Signal Processing. Piscataway, NJ: IEEE Press.
    1. Axmacher N., Mormann F., Fernandez G., Cohen M. X., Elger C. E., Fell J. (2007). Sustained neural activity patterns during working memory in the human medial temporal lobe. J. Neurosci. 27, 7807–7816. 10.1523/JNEUROSCI.0962-07.2007 - DOI - PMC - PubMed
    1. Baddeley A. (1992). Working memory. Science 255, 556–559. 10.1126/science.1736359 - DOI - PubMed
    1. Bliss T. V., Collingridge G. L. (1993). A synaptic model of memory: long-term potentiation in the hippocampus. Nature 361, 31–39. 10.1038/361031a0 - DOI - PubMed
    1. Brainard D. H. (1997). The psychophysics toolbox. Spat. Vis. 10, 433–436. 10.1163/156856897X00357 - DOI - PubMed