. 2015 Jan 21:8:98.
doi: 10.3389/fnint.2014.00098. eCollection 2014.

Visuo-tactile interactions in the congenitally deaf: a behavioral and event-related potential study

Affiliations

Visuo-tactile interactions in the congenitally deaf: a behavioral and event-related potential study

Nadine Hauthal et al. Front Integr Neurosci. .

Abstract

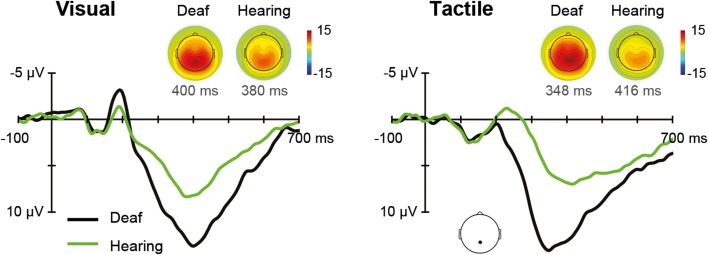
Auditory deprivation is known to be accompanied by alterations in visual processing. Yet not much is known about tactile processing and the interplay of the intact sensory modalities in the deaf. We presented visual, tactile, and visuo-tactile stimuli to congenitally deaf and hearing individuals in a speeded detection task. Analyses of multisensory responses showed a redundant signals effect that was attributable to a coactivation mechanism in both groups, although the redundancy gain was less in the deaf. In line with these behavioral results, on a neural level, there were multisensory interactions in both groups that were again weaker in the deaf. In hearing but not deaf participants, somatosensory event-related potential N200 latencies were modulated by simultaneous visual stimulation. A comparison of unisensory responses between groups revealed larger N200 amplitudes for visual and shorter N200 latencies for tactile stimuli in the deaf. Furthermore, P300 amplitudes were also larger in the deaf. This group difference was significant for tactile and approached significance for visual targets. The differences in visual and tactile processing between deaf and hearing participants, however, were not reflected in behavior. Both the behavioral and electroencephalography (EEG) results suggest more pronounced multisensory interaction in hearing than in deaf individuals. Visuo-tactile enhancements could not be explained by perceptual deficiency, but could be partly attributable to inverse effectiveness.

Keywords: cross-modal plasticity; deafness; multisensory processing; race model; redundant signals effect.


Figures

Figure 1
Figure 1
Active channels. Channel activity is defined as the standard deviation across time of the grand average data for each group separately and for group differences. The time window for the tactile and visual condition as well as the interaction (VT + nostim − V − T) was 80–300 ms (first three columns). A clear single peak channel is evident in both groups for each sensory modality. For the P300, shown as an average of the visual and tactile conditions, a time window of 200–500 ms was used (fourth column).
Figure 2
Figure 2
Response time distribution for visual (V), tactile (T), and redundant signals (VT) as well as the bounding sum (V + T).
Figure 3
Figure 3
Tactile stimulation. Left: Grand average ERPs recorded at a fronto-central electrode site are shown for deaf and hearing participants. The unisensory tactile response T is depicted in blue whereas the [VT + nostim – V] response is depicted in red. The [VT + nostim – V – T] response reflecting the interaction is illustrated in green. N200 latencies to unisensory tactile stimuli were shorter in the deaf than the hearing group. Moreover, shorter latencies for [VT + nostim – V] than unisensory tactile T responses (i.e., multisensory enhancement) were observed in hearing, but not in deaf participants for the N200 peak. Right: Topographies of grand average ERPs are shown for deaf and hearing participants. The topographies at the P100 and N200 peaks are given separately for the unisensory T response. Topographies of the [VT + nostim – V – T] response (i.e., the interaction) are also shown.
Figure 4
Figure 4
Visual stimulation. Left: Grand average ERPs recorded at an occipital electrode site are shown for deaf and hearing participants. The unisensory visual response V is depicted in blue whereas the [VT + nostim – T] response is depicted in red. The [VT + nostim – T – V] response reflecting the interaction is illustrated in green. N200 amplitudes were stronger in the deaf than in the hearing group. Moreover, stronger N200 amplitudes and shorter N200 latencies for [VT + nostim – T] than for unisensory visual V responses (i.e., multisensory enhancement) were observed in both groups. Right: Topographies of grand average ERPs are presented for deaf and hearing participants. The topographies at the P100 and N200 peaks are given separately for the unisensory V and [VT + nostim − T] response. Topographies of the [VT + nostim – T – V] response (i.e., the interaction) are also shown.
Figure 5
Figure 5
Unisensory ERPs. Grand average ERPs recorded at a parietal electrode site are illustrated for deaf and hearing participants. The left panel shows unisensory visual and the right panel unisensory tactile responses. P300 topographies of grand average ERPs are shown separately for deaf and hearing participants.

Similar articles

Cited by

References

    1. Armstrong B. A., Neville H. J., Hillyard S. A., Mitchell T. V. (2002). Auditory deprivation affects processing of motion, but not color. Brain Res. Cogn. Brain Res. 14, 422–434. 10.1016/S0926-6410(02)00211-2 - DOI - PubMed
    1. Bell A. J., Sejnowski T. J. (1995). An information maximation approach to blind separation and blind deconvolution. Neural Comput. 7, 1129–1159. 10.1162/neco.1995.7.6.1129 - DOI - PubMed
    1. Besle J., Fort A., Delpuech C., Giard M. H. (2004). Bimodal speech: early suppressive visual effects in human auditory cortex. Eur. J. Neurosci. 20, 2225–2234. 10.1111/j.1460-9568.2004.03670.x - DOI - PMC - PubMed
    1. Bottari D., Caclin A., Giard M. H., Pavani F. (2011). Changes in early cortical visual processing predict enhanced reactivity in deaf individuals. PLoS ONE 6:e25607. 10.1371/journal.pone.0025607 - DOI - PMC - PubMed
    1. Bottari D., Heimler B., Caclin A., Dalmolin A., Giard M., Pavani M. (2014). Visual change detection recruits auditory cortices in early deafness. Neuroimage 96, 172–184. 10.1016/j.neuroimage.2014.02.031 - DOI - PubMed

LinkOut - more resources