. 2015 Jan 15:3:e729.
doi: 10.7717/peerj.729. eCollection 2015.

The socio-matrix reloaded: from hierarchy to dominance profile in wild lemurs

Affiliations

The socio-matrix reloaded: from hierarchy to dominance profile in wild lemurs

Ivan Norscia et al. PeerJ. .

Abstract

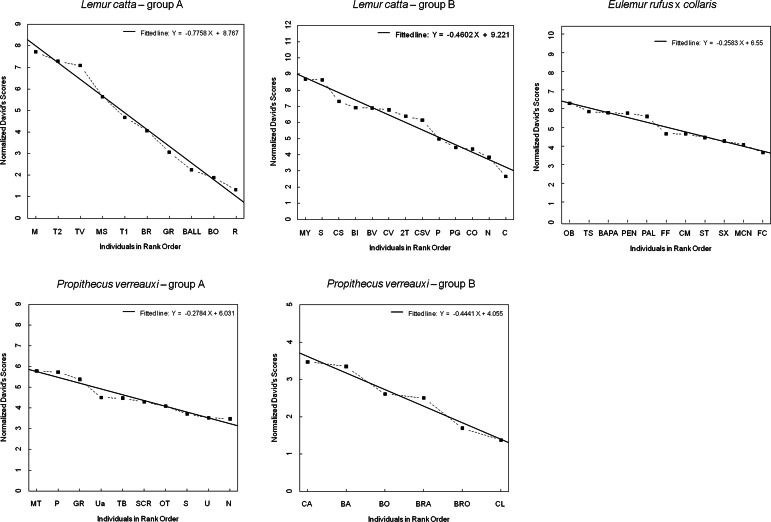
Dominance hierarchy influences the life quality of social animals, and its definition should in principle be based on the outcome of agonistic interactions. However, defining and comparing the dominance profile of social groups is difficult due to the different dominance measures used and because no one measure explains it all. We applied different analytical methods to winner-loser sociomatrices to determine the dominance profile of five groups of wild lemurs (species: Lemur catta, Propithecus verreauxi, and Eulemur rufus x collaris) from the Berenty forest (Madagascar). They are an excellent study model because they share the same habitat and an apparently similar dominance profile: linear hierarchy and female dominance. Data were collected over more than 1200 h of observation. Our approach included four steps: (1) by applying the binary dyadic dominance relationship method (I&SI) on either aggressions or supplant sociomatrices we verified whether hierarchy was aggression or submission based; (2) by calculating normalized David's scores and measuring steepness from aggression sociomatrices we evaluated whether hierarchy was shallow or steep; (3) by comparing the ranking orders obtained with methods 1 and 2 we assessed whether hierarchy was consistent or not; and (4) by assessing triangle transitivity and comparing it with the linearity index and the level of group cohesion we determined if hierarchy was more or less cohesive. Our results show that L. catta groups have got a steep, consistent, highly transitive and cohesive hierarchy. P. verreauxi groups are characterized by a moderately steep and consistent hierarchy, with variable levels of triangle transitivity and cohesion. E. rufus x collaris group possesses a shallow and inconsistent hierarchy, with lower (but not lowest) levels of transitivity and cohesion. A multiple analytical approach on winner-loser sociomatrices other than leading to an in-depth description of the dominance profile, allows intergroup and cross-species comparisons.

Keywords: Lemurs; Linearity; Madagascar; Prosimians; Sifaka; Social management; Steepness; Strepsirhines; Transitivity.


Figures

Figure 1
Figure 1. Normalized David’s scores plotted against rank order.
The graph—output of Steepness 2.2—shows normalized David’s scores (corrected for chance, based on aggression sociomatrices) plotted against ordinal rank order (dashed black line), and the fitted line (black, solid line) for all the study groups (Lemur catta A and B, Propithecus verreauxi A and B, Eulemur rufus x collaris). The Y axis reports the Normalized David’s scores and the X axis reports the individuals of each group.
Figure 2
Figure 2. Results of the one-way analysis of covariance (ANCOVA).
SPSS 20.0 output of the ANCOVA test run to check for between-group differences in hierarchical steepness. Dependent variable: Normalized David’s Scores (NDS); Fixed factor: Group ID; Co-variate: rank attributed by NDS.
Figure 3
Figure 3. Difference in the group cohesion around the dominant across the five study groups.
Box plot showing the comparison of the absolute differences of NDS values between adjacently ranked individuals of each group, across the five study groups (LcA, Lemur catta A; LcB, Lemur catta B; PvA, Propithecus verreauxi A; PvB, Propithecus verreauxi B; E, Eulemur rufus x collaris). Sample size (individuals): nLcA = 9, nLcB = 11, nPvA = 9, nPvB = 5, nE = 9. Results of the post-hoc randomization tests on two independent samples: PvB versus PvA: t = −0.704, p = 0.506; E versus PvB: t = 0.642, p = 0.545; E versus PvA; t = −0.068, p = 0.943; PvB versus LcB: t = 0.160, p = 0.281; PvA versus LcB; t = 2.150, p = 0.046; PvA versus LcA; t = 3.479; p = 0.005; PvB versus LcA; t = 2.225, p = 0.044; E versus LcB: t = 2.078, p = 0.049; E versus LcA: t = 3.462, p = 0.003; LcB versus LcA: t = 0.846, p = 0.413. (*) significant results (p < 0.05); (**) highly significant results (p < 0.01). Solid horizontal lines indicate medians; length of the boxes corresponds to inter-quartile range; thin horizontal lines indicate the range of observed values.
Figure 4
Figure 4. Difference in the group cohesion around the dominant across the five study groups.
Box plot showing the difference in group cohesion around the dominant (proportion of individuals within 20 m from the dominant over the total animal number) across the five study groups (LcA, Lemur catta A; LcB, Lemur catta B; PvA, Propithecus verreauxi A; PvB, Propithecus verreauxi B; E, Eulemur rufus x collaris). Observational cohesion bouts for the five groups: nLcA = 65, nLcB = 40, nPvA = 60, nPvB = 77, nE = 34. Results of the post-hoc randomization tests on two independent samples: PvB versus PvA: t = −1.656, p = 0.101; E versus PvB: t = 2.101, p = 0.036; E versus PvA; t = 2.355, p = 0.021; PvB versus LcB: t = −1.800, p = 0.080; PvA versus LcB; t = −1.592, p = 0.121; PvA versus LcA; t = −1.581; p = 0.118; PvB versus LcA; t = −1.901, p = 0.058; E versus LcB: t = −2.995, p = 0.004; E versus LcA: t = −3.840, p < 0.001; LcB versus LcA: t = −0.326, p = 0.752. () significant results (p < 0.05); (∗∗) highly significant results (p < 0.01); (∗∗∗) extremely significant results (p < 0.001). Solid horizontal lines indicate medians; length of the boxes corresponds to inter-quartile range; thin horizontal lines indicate the range of observed values.

Similar articles

Cited by

References

    1. Altmann J. Observational study of behaviour sampling methods. Behaviour. 1974;49:227–265. doi: 10.1163/156853974X00534. - DOI - PubMed
    1. Alvarez F. Social hierarchy under different criteria in groups of squirrel monkeys, Saimiri sciureus. Primates. 1975;16:437–455. doi: 10.1007/BF02382741. - DOI
    1. Appleby MC. The probability of linearity in hierarchies. Animal Behaviour. 1983;31:600–608. doi: 10.1016/S0003-3472(83)80084-0. - DOI
    1. Balasubramaniam KN, Dittmar K, Berman CM, Butovskaya M, Cooper MA, Majolo B, Ogawa H, Schino G, Thierry B, de Waal FBM. Hierarchical steepness, counter-aggression, and macaque social style scale. American Journal of Primatology. 2012;74:915–925. doi: 10.1002/ajp.22044. - DOI - PubMed
    1. Bernstein IS. Dominance: the baby and the bathwater. Behavioral and Brain Sciences. 1981;4:419–457. doi: 10.1017/S0140525X00009614. - DOI