Review
. 2015 Jan 20:2:87.
doi: 10.3389/fbioe.2014.00087. eCollection 2014.

Bridging the gap: a roadmap to breaking the biological design barrier

Affiliations
Review

Bridging the gap: a roadmap to breaking the biological design barrier

Jacob Beal. Front Bioeng Biotechnol. .

Abstract

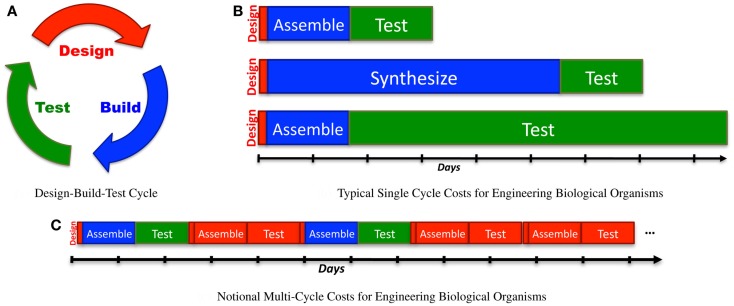
This paper presents an analysis of an emerging bottleneck in organism engineering, and paths by which it may be overcome. Recent years have seen the development of a profusion of synthetic biology tools, largely falling into two categories: high-level "design" tools aimed at mapping from organism specifications to nucleic acid sequences implementing those specifications, and low-level "build and test" tools aimed at faster, cheaper, and more reliable fabrication of those sequences and assays of their behavior in engineered biological organisms. Between the two families, however, there is a major gap: we still largely lack the predictive models and component characterization data required to effectively determine which of the many possible candidate sequences considered in the design phase are the most likely to produce useful results when built and tested. As low-level tools continue to mature, the bottleneck in biological systems engineering is shifting to be dominated by design, making this gap a critical barrier to progress. Considering how to address this gap, we find that widespread adoption of readily available analytic and assay methods is likely to lead to rapid improvement in available predictive models and component characterization models, as evidenced by a number of recent results. Such an enabling development is, in turn, likely to allow high-level tools to break the design barrier and support rapid development of transformative biological applications.

Keywords: automation; calibrated flow cytometry; design; metrology; organism engineering; prediction; synthetic biology.


Figures

Figure 1
Figure 1
When analyzing synthetic biology against a classic design-build-test cycle (A), analysis of a single cycle hides the cost of design, since the relative effort expended in a single cycle is typically quite low: (B) illustrates this with typical examples of time expended in a single cycle: a few minutes or hours of design, followed by construction of a design via BioBrick assembly (Knight, 2003) from existing sequence fragments or via an expedited order from a next-generation synthesis company, and then a 1-day test (e.g., a simple bacterial circuit) or a 1-week test (e.g., testing a memory circuit). A better measure, however, also takes into account the number of cycles required due to imprecision in design: (C) illustrates a sequence of design-build-test cycles in which any cycle that turns out not to be productive is accounted as a cost of problems in design.
Figure 2
Figure 2
Table of significant notation used for analysis of organism engineering bottlenecks.
Figure 3
Figure 3
Decreased time per assay has sharply limited benefits, as illustrated by comparison of the bit size of example moderate- complexity circuits to rates of configuration space exploration (A). Solid lines show the number of bits of configuration space that can be assayed in a sequence of 1-week cycles with various methods (starting with a single parallel assay at week 1), while dashed lines show the complexity of the example circuits in Section 2. Improving models and components can dramatically reduce the required number of assays: (B) illustrates how a model-driven design process for the seven-repressor circuit might progress incrementally by breaking the system into three sequentially engineered subsystems (solid lines with diamonds marking sequence steps; manual is blue, robotic is green), and how that might be further improved with insulators that eliminate the effect of ordering and strand choice (dashed lines with stars marking sequence steps; manual is blue, robotic is green). For (B), progress toward completion is shown by graphing H(S, 0) − H(S, i) for each circuit. Note that for the lowest manual line, no diamond appears because the first step is not completed for more than 6 months.
Figure 4
Figure 4
Assays that measure population means or totals cannot distinguish between even radically different distributions of expression. For example, the tight (A), broad (B), and bimodal (C) distributions illustrated above all have the same mean and total fluorescence.
Figure 5
Figure 5
Examples of flow cytometry data showing complex population variation driven by multiple phenomena, with labels on key portions of the distribution used for estimating model parameters: (A) transient transfection of a single constitutively expressed fluorescent protein, from Adler et al. (2014), and (B) cotransfection of two replicons with constitutively expressed fluorescent proteins, from Beal et al. (2014). Both graphs indicate distribution density with color, with dark red indicating the maximum density, and outlier data (those in areas with less than 5% of maximum density) indicated by gray dots.
Figure 6
Figure 6
The TASBE method (Beal et al., 2012) for calibrated flow cytometry uses four controls: correction for autofluorescence and spectral overlap is computed from the negative and single-positive controls. Calibration beads provide a conversion from arbitrary units to molecules of equivalent fluorescein (MEFL) on the FITC channel, and multi-color controls allow all other channels to be converted to equivalent FITC units and thence to MEFL. Data shown are from sample material on Adler et al. (2014).
Figure 7
Figure 7
Larger versions of the sample controls shown with the TASBE method workflow in Figure 6. (A) Computation of autofluorescence from negative control. (B) Computation of spectral overlap from single positive control. (C) Computation of from MEFL conversion factor from calibration beads. (D) Computation of color conversion factor from multi-color control.
Figure 8
Figure 8
Population distribution of a constitutive fluorescent protein (CFP) can be used to identify protocol problems, from individual samples (A) to entire replicates (B). Data shown are from sample material on Adler et al. (2014): solid lines are observed distribution, dashed lines are bimodal model fit, used for quantitative comparison of sample to expected distribution.
Figure 9
Figure 9
Component models built using calibrated flow cytometry data enable high-precision predictions of multi-component systems. For example, (A) models of single- and dual-replicon transfection can predict (dashed lines) the observed histogram for distribution of fluorescence (lines with stars, two replicates) in a three-replicon mixture (figure from Beal et al. (2014), and (B) repressor models can predict the observed mean and population distribution of fluorescent expression of combinational circuits such as the two-repressor cascade shown [figure from Davidsohn et al. (2014)].

Similar articles

Cited by

References

    1. Adler A., Yaman F., Beal J. (2014). TASBE Tools. Available at: https://synbiotools.bbn.com/
    1. Amdahl G. M. (1967). “Validity of the single processor approach to achieving large-scale computing capabilities,” in AFIPS Conference Proceedings, Vol. 30 (Reston, VA: AFIPS Press), 483–485.
    1. Beal J., Bachrach J. (2008). “Cells are plausible targets for high-level spatial languages,” in Proceedings of the 2008 Second IEEE International Conference on Self-Adaptive and Self-Organizing Systems Workshops (SASOW’08) (Washington, DC: IEEE Computer Society), 284–291.
    1. Beal J., Lu T., Weiss R. (2011). Automatic compilation from high-level biologically-oriented programming language to genetic regulatory networks. PLoS ONE 6:e22490.10.1371/journal.pone.0022490 - DOI - PMC - PubMed
    1. Beal J., Wagner T. E., Kitada T., Azizgolshani O., Parker J. M., Densmore D., et al. (2014). Model-driven engineering of gene expression from RNA replicons. ACS Synth. Biol. 10.1021/sb500173f - DOI - PubMed