. 2015:2015:363575.
doi: 10.1155/2015/363575. Epub 2015 Jan 13.

Identification of reference genes in human myelomonocytic cells for gene expression studies in altered gravity

Affiliations

Identification of reference genes in human myelomonocytic cells for gene expression studies in altered gravity

Cora S Thiel et al. Biomed Res Int. 2015.

Abstract

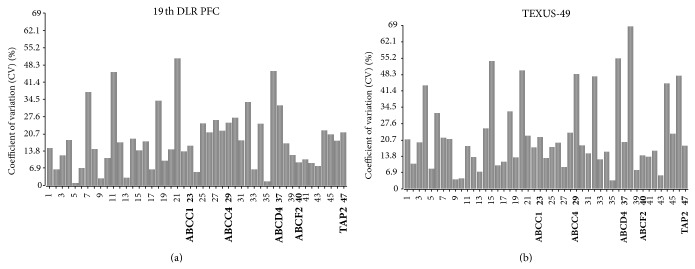
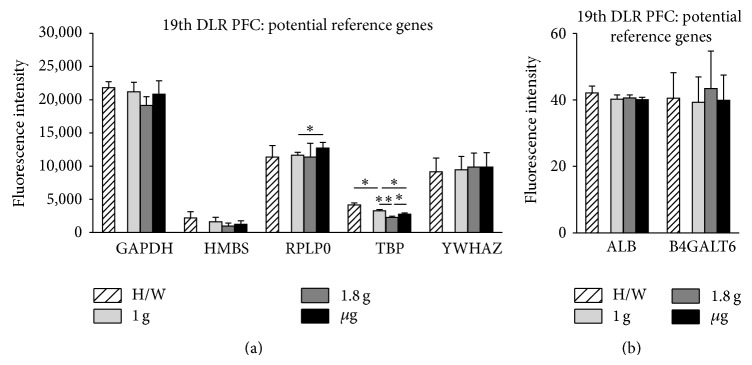
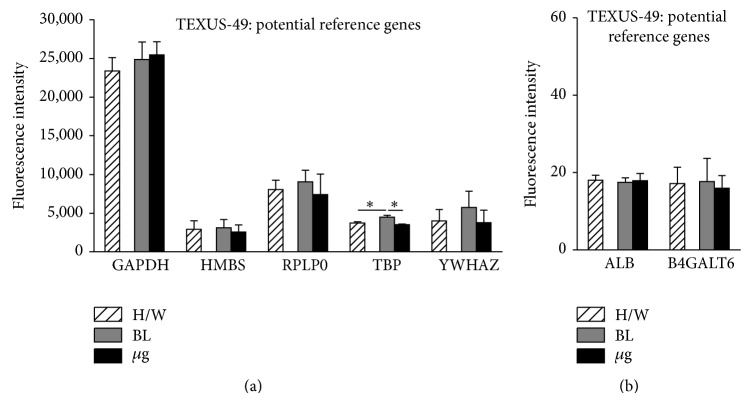
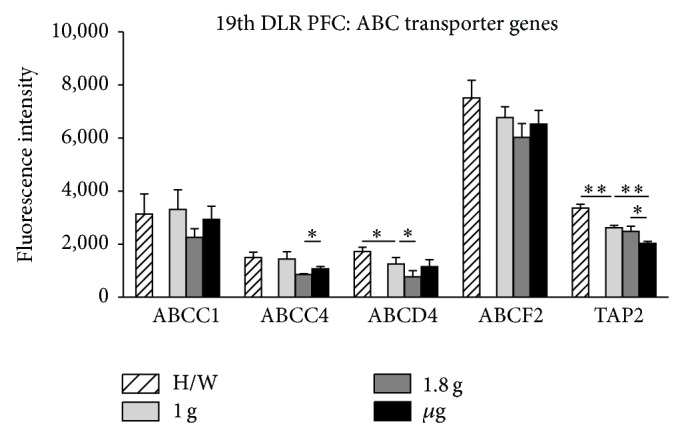
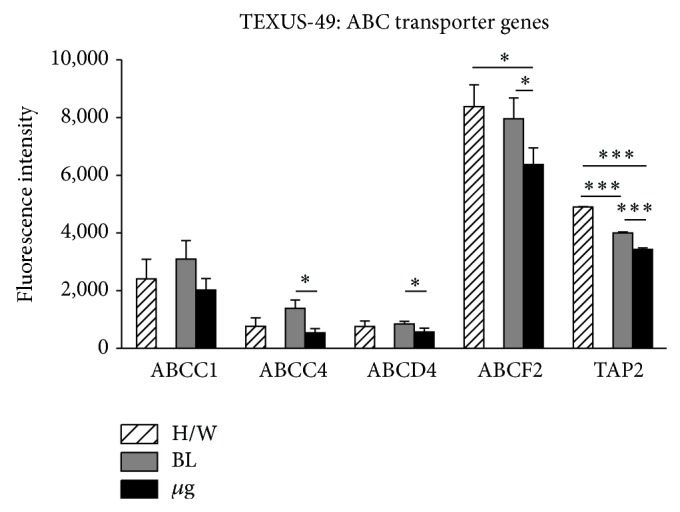
Gene expression studies are indispensable for investigation and elucidation of molecular mechanisms. For the process of normalization, reference genes ("housekeeping genes") are essential to verify gene expression analysis. Thus, it is assumed that these reference genes demonstrate similar expression levels over all experimental conditions. However, common recommendations about reference genes were established during 1 g conditions and therefore their applicability in studies with altered gravity has not been demonstrated yet. The microarray technology is frequently used to generate expression profiles under defined conditions and to determine the relative difference in expression levels between two or more different states. In our study, we searched for potential reference genes with stable expression during different gravitational conditions (microgravity, normogravity, and hypergravity) which are additionally not altered in different hardware systems. We were able to identify eight genes (ALB, B4GALT6, GAPDH, HMBS, YWHAZ, ABCA5, ABCA9, and ABCC1) which demonstrated no altered gene expression levels in all tested conditions and therefore represent good candidates for the standardization of gene expression studies in altered gravity.


Figures

Figure 1
Figure 1
Boxplots showing the log expression values of individual microarrays. The central line represents the 50th percentile or median, whereas the upper and lower boundaries of the box display the 75th and 25th percentile, respectively. The upper and lower bars represent the 9th and the 91st percentile. Two experimental data sets are displayed, (a) 28 microarrays hybridized with samples from the 19th DLR PFC (8x μg, 6x H/W, 8x 1 g, 6x 1.8 g) and (b) 18 microarrays hybridized with samples originating from the TEXUS-49 campaign (7x μg, 6x H/W, 5x 1 g). The expression data show an even distribution for the displayed log intensities.
Figure 2
Figure 2
Heatmaps for selected reference genes. The graph illustrates fluorescent intensity levels of the 20 potential reference genes from Table 2 between the three and four different gravity conditions, respectively. Each gene is represented in one column, and each gravity condition is represented in one row. (a) μg, H/W, 1 g, and 1.8 g (19th DLR PFC) and (b) H/W, BL, and μg (TEXUS-49). The heatmap shows large variation in fluorescence intensities for the different genes. However, within the same gene, expression levels are similar for all tested conditions. The lower bar with the graduated red colors is the measure for the different fluorescence intensities.
Figure 3
Figure 3
Coefficient of variation calculation for the potential reference genes. This bar chart displays the coefficient of variation (CV) in % of the 20 potential reference genes across the gravity conditions for the 19th DLR PFC (H/W, 1 g, 1.8 g, μg) and TEXUS-49 (H/W, BL, μg). A lower value corresponds to higher stability in gene expression. (a) 19th DLR PFC: All calculated CV values are below the threshold of 50%. (b) TEXUS-49: all CV values are below 50%, but in total more genes show higher coefficients of variation.
Figure 4
Figure 4
Heatmaps for highly conserved ABC transporters. The fluorescent intensity levels of the 47 ABC transporter genes shown in supplementary Table 2 were quantified for the different gravity conditions. Each gene is represented in one column, and each gravity condition is represented in one row. (a) μg, 1 g, H/W, and 1.8 g (19th DLR PFC) and (b) μg, BL, and H/W (TEXUS-49). The heatmaps show large variation in fluorescence intensities for the different genes. However, within the same gene, expression levels are mostly similar for all tested conditions. The lower bar with the graduated red colors is the measure for the different fluorescence intensities.
Figure 5
Figure 5
Coefficient of variation calculation for the ABC transporter genes. This bar chart displays the coefficient of variation (CV) in % of the 47 ABC transporter genes across the gravity conditions for the 19th DLR PFC (H/W, 1 g, 1.8 g, μg) and TEXUS-49 (H/W, BL, μg). A lower value corresponds to higher stability in gene expression. (a) 19th DLR PFC: all calculated CV values are below the threshold of 50% and fulfill the criterion. (b) TEXUS-49: three genes show CV values higher than 50% and were excluded from further analyses. The numbers correspond to the ABC transporters listed in supplementary Table 2. Genes that were further analyzed are labeled and marked in bold (ABCC1, ABCC4, ABCD4, ABCF2, and TAP2).
Figure 6
Figure 6
Influence of altered gravity during parabolic flight on potential reference genes. RNA expression levels after 1 g (light gray), 1.8 g (dark gray), and μg (black) conditions during the 19th DLR parabolic flight campaign. Hardware ground controls (H/W, striped) are shown for each experimental group. RNA expression levels are shown as fluorescence intensities. (a) The expression values for GAPDH, HMBS, RPLP0, TBP, and YWHAZ are displayed. (b) ALB and B4GALT6 show low but stable fluorescent intensities. GAPDH, HMBS, YWHAZ, ALB, and B4GALT6 show no significant change in RNA levels upon altered gravity for 20 sec, while RPLP0 displays μg sensitivity compared to 1 g and TBP reacts sensitively to all g conditions. Mean values of at least three measurements with standard deviations are shown. * P < 0.05, ** P < 0.005.
Figure 7
Figure 7
Influence of altered gravity during sounding rocket flight on potential reference genes. GAPDH, HMBS, RPLP0, TBP, and YWHAZ (a), ALB and B4GALT6 (b) RNA expression levels after launch and acceleration (BL, dark gray) and μg (black) conditions of TEXUS-49. Hardware ground controls (H/W, striped) are shown for each experimental group. RNA levels are displayed as fluorescence intensities. GAPDH, HMBS, RPLP0, YWHAZ, ALB, and B4GALT6 show no significant change in RNA levels upon altered gravity, while TBP reacts sensitively to all g conditions. Mean values of at least three measurements with standard deviations are shown. * P < 0.05.
Figure 8
Figure 8
Influence of altered gravity during parabolic flight on ABC transporter genes. ABCC1, ABCC4, ABCD4, ABCF2, and TAP2 RNA levels after 1 g (light gray), 1.8 g (dark gray), and μg (black) conditions during the 19th DLR parabolic flight campaign. Hardware ground controls (H/W, striped) are shown for each experimental group. RNA expression levels are displayed as fluorescence intensities. ABCC1 and ABCF2 show no significant change in RNA expression levels upon altered gravity, while ABCC4 and TAP2 display μg sensitivity compared to 1.8 g and to 1.8 g and 1 g, respectively. ABCD4 reacts sensitively to 1.8 g compared to 1 g, and ABCD4 and TAP2 show vibration sensitivity comparing 1 g to H/W. Mean values of at least three measurements with standard deviations are shown. * P < 0.05, ** P < 0.005.
Figure 9
Figure 9
Influence of altered gravity during sounding rocket flight on ABC transporter genes. ABCC1, ABCC4, ABCD4, ABCF2, and TAP2 RNA expression levels after launch and acceleration (BL, dark gray) and μg (black) conditions of TEXUS-49. Hardware ground controls (H/W, striped) are shown for each experimental group. RNA levels are depicted as fluorescence intensities. Only ABCC1 expression is stable over all g conditions. ABCC4, ABCD4, ABCF2, and TAP2 display μg sensitivity compared to BL and to H/W in the case of ABCF2 and TAP2. TAP2 also shows vibration sensitivity comparing BL to H/W. Mean values of at least three measurements with standard deviations are shown. * P < 0.05, ** P < 0.005, and *** P < 0.0005.

Similar articles

Cited by

References

    1. Comet B. Limiting factors for human health and performance: microgravity and reduced gravity. In: study on the survivability and adaptation of humans to long-duration interplanetary and planetary environments. Technical Note 2: Critical Assessments of the Limiting Factors for Human Health and Performance and Recommendation of Countermeasures. 2001;(HUMEX-TN-002)
    1. Horneck G., Facius R., Reichert M., et al. HUMEX, a study on the survivability and adaptation of humans to long-duration exploratory missions, part II: missions to Mars. Advances in Space Research. 2006;38(4):752–759. doi: 10.1016/j.asr.2005.06.072. - DOI - PubMed
    1. Horneck G., Comet B. General human health issues for Moon and Mars missions: results from the HUMEX study. Advances in Space Research. 2006;37(1):100–108. doi: 10.1016/j.asr.2005.06.077. - DOI
    1. Guéguinou N., Huin-Schohn C., Bascove M., et al. Could spaceflight-associated immune system weakening preclude the expansion of human presence beyond Earth's orbit? Journal of Leukocyte Biology. 2009;86(5):1027–1038. doi: 10.1189/jlb.0309167. - DOI - PubMed
    1. Takayanagi H. Osteoimmunology: shared mechanisms and crosstalk between the immune and bone systems. Nature Reviews Immunology. 2007;7(4):292–304. doi: 10.1038/nri2062. - DOI - PubMed

Publication types

Substances