. 2015:2015:538786.
doi: 10.1155/2015/538786. Epub 2015 Jan 13.

Regulation of ICAM-1 in cells of the monocyte/macrophage system in microgravity

Affiliations

Regulation of ICAM-1 in cells of the monocyte/macrophage system in microgravity

Katrin Paulsen et al. Biomed Res Int. 2015.

Abstract

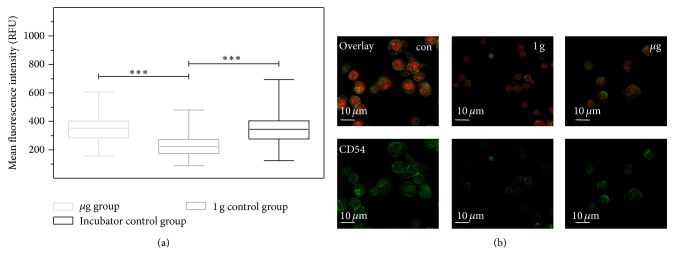
Cells of the immune system are highly sensitive to altered gravity, and the monocyte as well as the macrophage function is proven to be impaired under microgravity conditions. In our study, we investigated the surface expression of ICAM-1 protein and expression of ICAM-1 mRNA in cells of the monocyte/macrophage system in microgravity during clinostat, parabolic flight, sounding rocket, and orbital experiments. In murine BV-2 microglial cells, we detected a downregulation of ICAM-1 expression in clinorotation experiments and a rapid and reversible downregulation in the microgravity phase of parabolic flight experiments. In contrast, ICAM-1 expression increased in macrophage-like differentiated human U937 cells during the microgravity phase of parabolic flights and in long-term microgravity provided by a 2D clinostat or during the orbital SIMBOX/Shenzhou-8 mission. In nondifferentiated U937 cells, no effect of microgravity on ICAM-1 expression could be observed during parabolic flight experiments. We conclude that disturbed immune function in microgravity could be a consequence of ICAM-1 modulation in the monocyte/macrophage system, which in turn could have a strong impact on the interaction with T lymphocytes and cell migration. Thus, ICAM-1 can be considered as a rapid-reacting and sustained gravity-regulated molecule in mammalian cells.


Figures

Figure 1
Figure 1
Technology for cell culture experiments in different microgravity research platforms. (a) Fast-rotating two-dimensional (2D) clinostat manufactured by the German Aerospace Center (DLR, Cologne, Germany) was used to provide simulated microgravity. Under the chosen experimental conditions (60 rpm, 4 mm pipette diameter) a maximal residual acceleration of 4 × 10⁻³ g is achieved at the outer radius of the pipette and decreases towards the center. (b) Experimental hardware structure which consists of an incubator rack to store the cell containers temporarily before the experiment at 37°C (left), an experimental rack in which all active aggregates are accommodated and where the living cells are handled during altered gravity (right) and a cooling rack to temporarily store all cell containers after the injection of the stop/fixation liquid at 4°C until landing (front). (c) Payload of TEXUS-49 sounding rocket tempered and vacuum-resistant container with experiment syringe systems. (d) Plunger unit EUE for SIMBOX (Science in Microgravity Box) incubator system, support structure (housing made of PEEK), which includes three culture chambers and six supply units, two for each culture compartment. Each culture chamber represents an independent loop. The culture chambers filled with medium are closed on the top of the housing by means of polycarbonate specimen window slides, where the adherent cells are attached beforehand. The housing is tightened by silicon sealing and covered by an aluminum plate (cover) fixed with screws.
Figure 2
Figure 2
Cytometry analysis of ICAM-1 expression in BV-2 microglial cells in simulated microgravity (2D clinorotation). BV-2 microglial cells were exposed to either clinorotation (μg), placed in the clinostat but not rotated (1 g control group), or cultured under standard cell culture conditions (incubator control) for 24 h. Cells were stained for ICAM-1 surface expression and analyzed by flow cytometry. The level of ICAM-1 surface expression is represented by the mean fluorescent intensity assessed by flow cytometry. (a) In forward/sideward scatter detection mode of flow cytometry, two gates were set to separate two subtypes of BV-2 microglial cells that appeared different in size and granulation (subtypes 1 and 2 in dot plots). (b) Distribution of BV-2 microglial cells in subtypes 1 and 2 after exposure to different gravity conditions. (c) Quantification of ICAM-1 expression after exposure to different gravity conditions within subtypes 1 and 2. Data are given as median ± SE (* P < 0.1, ** P < 0.05, *** P < 0.01, n = 3, according to one-way ANOVA followed by Wilcoxon or unpaired t-test).
Figure 3
Figure 3
ICAM-1 surface expression reacts rapidly and reversibly to microgravity. (a) Microscopy of ICAM-1, TUNEL, HCS CellMask, and DAPI including surface calculation for HCS. In order to identify nuclei, cells were stained with DAPI (A). Apoptotic cells were identified by TUNEL reaction (B) and HCS CellMask label (C) which can be retained to a higher extend in nonapoptotic cells. ICAM-1 intensity is depicted in (D). A merge of TUNEL, DAPI, and ICAM-1 (E) shows an apoptotic cell (◄) and a living cell (→). The automated calculation of an iso-surface is exclusively done for living cells using the HCS CellMask channel as shown in the merge with TUNEL, DAPI, and ICAM-1 (F). (b)–(j) BV-2 microglial cells were treated with PMA ((e), (f), and (g)) or TNF-α ((h), (i), and (j)) at the onset of microgravity or during the 1 g in-flight control phase or left untreated ((b), (c), and (d)). Cells were fixed in flight after 20 sec normogravity (1 g) (-●-) or 20 sec microgravity (μg) (-○-). Cells were stained, imaged, and analyzed as described above. The mean intensity of the ICAM-1 signal was binned into mean intensity fluorescence (MIF) categories and the number of cells (frequency) is plotted against these intensity categories ((b), (e), and (h)). ICAM-1 fluorescence intensity of all analyzed cells ((c), (f), and (i)) is depicted for normogravity (triangles) and microgravity (squares). Mean ICAM-1 fluorescence intensity of all analyzed cells ((d), (g), and (j)) was pooled for normogravity (black bar) and microgravity (open bar). For automated imaging, the unified random sampling module was utilized and 63 randomized images of each sample were recorded and at least 500 single cells from 3 independent experiments from 3 different parabolas were analyzed. Mean intensity and SEM are shown and student's t-test showed highly significant difference of the fluorescence values of  *** P < 0.0001, n = 3.
Figure 4
Figure 4
Cytometry analysis of ICAM-1 expression in macrophage-like differentiated U937 cells or primary human macrophages in simulated microgravity (2D clinorotation). Macrophage-like differentiated U937 cells (a) or primary human macrophages (b) were exposed to either clinorotation (μg), placed in the clinostat but not rotated (1 g control group), or cultured under standard cell culture conditions (incubator control). Cells were stained for ICAM-1 surface expression and analyzed by flow cytometry. The level of ICAM-1 surface expression is represented by the mean fluorescent intensity assessed by flow cytometry. (a) Quantification of ICAM-1 expression in macrophage-like differentiated U937 cells after exposure to different gravity conditions for 1 h, 3 h, or 5 h, n = 6. (b) Quantification of ICAM-1 expression in primary human macrophages after exposure to different gravity conditions for 1 h, 3 h, or 5 h, n = 3. Data are given as median ± SE (* P < 0.1, ** P < 0.05, *** P < 0.01, according to one-way ANOVA followed by Wilcoxon or unpaired t-test).
Figure 5
Figure 5
ICAM-1 expression in U937 cells, macrophage-like differentiated U937 cells, and primary human macrophages in different gravity conditions during parabolic flight experiment. ICAM-1 expression was assessed by flow cytometry and fluorescent microscopy following immunocytochemical staining. Cells were cultured under standard cell culture conditions (incubator control) or exposed to different gravity conditions during the 19th DLR parabolic flight campaign. U937 cells were fixed either after PMA-activation in microgravity (μg group) or in 1 g (1 g control group). Differentiated U937 and primary macrophages were fixed after the microgravity phases (μg group) or after the 1 g phases before and after the μg phase (1 g control group). The level of ICAM-1 surface expression is represented by the mean fluorescent intensity assessed by flow cytometry. (a) ICAM-1 surface expression in myelomonocytic U937 cells (mon. U937) and macrophage-like differentiated U937 cells (max. U937) under standard cell culture conditions. (b) ICAM-1 surface expression in U937 cells with and without activation by PMA in different gravity conditions. (c) ICAM-1 surface expression in macrophage-like differentiated U937 cells in different gravity conditions. (d) ICAM-1 surface expression in primary macrophages in different gravity conditions. Data are given as median ± SE (* P < 0.1, ** P < 0.05, and *** P < 0.01, according to one-way ANOVA followed by Wilcoxon or unpaired t-test).
Figure 6
Figure 6
ICAM-1 expression in macrophage-like differentiated U937 cells after long-term exposure to microgravity during the SIMBOX/Shenzhou-8 mission. Cells were cultured under standard cell culture conditions (incubator control) or exposed to different gravity conditions during the SIMBOX/Shenzhou-8 mission. Differentiated U937 cells were fixed in microgravity (μg group) or in 1 g (1 g control group) after 5 days. Only CellMask-positive and TUNEL-negative cells were analyzed. (a) Each group represents analysis of the mean fluorescence of 200–1000 individual cells from one recovered slide. Data are expressed as the median of mean single cell fluorescence intensities with the smallest observation (sample minimum), lower quartile, median, upper quartile, and largest observation (sample maximum). Statistical analysis was performed with GraphPad Prism 5, Wilcoxon test, * P < 0.05, ** P < 0.01, and *** P < 0.001. (b) Standard cell culture control (con), 1 g hardware control (1 g) and the microgravity sample (μg).
Figure 7
Figure 7
Influence of altered gravity during parabolic flight and sounding rocket flight on ICAM-1 mRNA expression levels. (a) ICAM-1 mRNA expression levels are demonstrated for samples of the 19th DLR parabolic flight campaign after 1 g (light gray), 1.8 g (dark gray), μg (black), and hardware ground controls (H/W, striped) exposure and (b) for samples of the TEXUS-49 campaign after launch and acceleration (BL, dark gray), μg (black), and hardware ground controls (H/W, striped). ICAM-1 fluorescence intensities do not show any significant differences for all compared conditions in both experimental setups. The number of analyzed arrays: 19th DLR PFC: 1 g (n = 8), 1.8 g (n = 6), μg (n = 8) and H/W (n = 6); TEXUS-49: H/W (n = 6), μg (n = 7), BL (n = 5).

Similar articles

Cited by

References

    1. Sonnenfeld G. The immune system in space and microgravity. Medicine and Science in Sports and Exercise. 2002;34(12):2021–2027. doi: 10.1097/00005768-200212000-00024. - DOI - PubMed
    1. Ullrich O., Huber K., Lang K. Signal transduction in cells of the immune system in microgravity. Cell Communication and Signaling. 2008;6, article 9 doi: 10.1186/1478-811X-6-9. - DOI - PMC - PubMed
    1. Guéguinou N., Huin-Schohn C., Bascove M., et al. Could spaceflight-associated immune system weakening preclude the expansion of human presence beyond Earth's orbit? Journal of Leukocyte Biology. 2009;86(5):1027–1038. doi: 10.1189/jlb.0309167. - DOI - PubMed
    1. Ullrich O., Thiel C. S. Gravitational force: triggered stress in cells of the immune system. In: Choukèr A., editor. Stress Challenges, and Immunity in Space: From Mechanisms to Monitoring and Preventive Strategies. chapter 14. Berlin, Germany: Springer; 2012. pp. 187–202. - DOI
    1. Konstantinova I. V., Antropova E. N., Legen'kov V. I., Zazhireĭ V. D. Reactivity of lymphoid blood cells in the crew of “Soiuz-6”, “Soiuz-7” and “Soiuz-8” spacecraft before and after flight. Kosmicheskaia Biologiia i Aviakosmicheskaia Meditsina. 1973;7(6):35–40. - PubMed

Publication types

Substances

LinkOut - more resources