Lactobacillus acidophilus ATCC 4356 inhibits biofilm formation by C. albicans and attenuates the experimental candidiasis in Galleria mellonella
- PMID: 25654408
- PMCID: PMC4603435
- DOI: 10.4161/21505594.2014.981486
Lactobacillus acidophilus ATCC 4356 inhibits biofilm formation by C. albicans and attenuates the experimental candidiasis in Galleria mellonella
Abstract
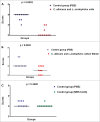
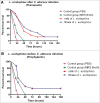
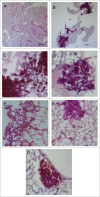
Probiotic strains of Lactobacillus have been studied for their inhibitory effects on Candida albicans. However, few studies have investigated the effect of these strains on biofilm formation, filamentation and C. albicans infection. The objective of this study was to evaluate the influence of Lactobacillus acidophilus ATCC 4356 on C. albicans ATCC 18804 using in vitro and in vivo models. In vitro analysis evaluated the effects of L. acidophilus on the biofilm formation and on the capacity of C. albicans filamentation. For in vivo study, Galleria mellonella was used as an infection model to evaluate the effects of L. acidophilus on candidiasis by survival analysis, quantification of C. albicans CFU/mL, and histological analysis. The direct effects of L. acidophilus cells on C. albicans, as well as the indirect effects using only a Lactobacillus culture filtrate, were evaluated in both tests. The in vitro results showed that both L. acidophilus cells and filtrate were able to inhibit C. albicans biofilm formation and filamentation. In the in vivo study, injection of L. acidophilus into G. mellonella larvae infected with C. albicans increased the survival of these animals. Furthermore, the number of C. albicans CFU/mL recovered from the larval hemolymph was lower in the group inoculated with L. acidophilus compared to the control group. In conclusion, L. acidophilus ATCC 4356 inhibited in vitro biofilm formation by C. albicans and protected G. mellonella against experimental candidiasis in vivo.
Keywords: ATCC, American type culture collection; BHI, Brain heart infusion; CFU, colony-forming unit; Candida albicans; Galleria mellonella; HE, hematoxylin-eosin; Lactobacillus acidophilus; MRS, Man, Rogosa and Sharpe; NIH, National Institutes of Health; PAS, periodic acid-Schiff; PBS, phosphate buffered saline; SEM, Scanning electron microscopy; YNB, Yeast nitrogen base; biofilm; candidiasis; filamentation; pH, potential hydrogen ion; probiotic.
Figures


Similar articles
-
Clinical strains of Lactobacillus reduce the filamentation of Candida albicans and protect Galleria mellonella against experimental candidiasis.Folia Microbiol (Praha). 2018 May;63(3):307-314. doi: 10.1007/s12223-017-0569-9. Epub 2017 Nov 23. Folia Microbiol (Praha). 2018. PMID: 29170992
-
Lactobacillus rhamnosus inhibits Candida albicans virulence factors in vitro and modulates immune system in Galleria mellonella.J Appl Microbiol. 2017 Jan;122(1):201-211. doi: 10.1111/jam.13324. Epub 2016 Nov 15. J Appl Microbiol. 2017. PMID: 27727499
-
Probiotics research in Galleria mellonella.Virulence. 2015;6(1):3-5. doi: 10.1080/21505594.2014.998967. Virulence. 2015. PMID: 25654691 Free PMC article. No abstract available.
-
Action mechanisms of probiotics on Candida spp. and candidiasis prevention: an update.J Appl Microbiol. 2020 Aug;129(2):175-185. doi: 10.1111/jam.14511. Epub 2019 Nov 21. J Appl Microbiol. 2020. PMID: 31705713 Review.
-
Potential Action of Lactobacillus Probiotics Against Fungi of the Genus Candida: A Bibliographic Review.Recent Pat Biotechnol. 2023;17(3):198-205. doi: 10.2174/1872208317666221027093644. Recent Pat Biotechnol. 2023. PMID: 36305126 Review.
Cited by
-
Biofilm models of polymicrobial infection.Future Microbiol. 2015;10(12):1997-2015. doi: 10.2217/fmb.15.109. Epub 2015 Nov 23. Future Microbiol. 2015. PMID: 26592098 Free PMC article. Review.
-
Update of Probiotics in Human World: A Nonstop Source of Benefactions till the End of Time.Microorganisms. 2020 Nov 30;8(12):1907. doi: 10.3390/microorganisms8121907. Microorganisms. 2020. PMID: 33266303 Free PMC article. Review.
-
Antifungal effects of Lactobacillus acidophilus and Lactobacillus plantarum against different oral Candida species isolated from HIV/ AIDS patients: an in vitro study.J Oral Microbiol. 2020 May 25;12(1):1769386. doi: 10.1080/20002297.2020.1769386. J Oral Microbiol. 2020. PMID: 32922676 Free PMC article.
-
Influence of Streptococcus mitis and Streptococcus sanguinis on virulence of Candida albicans: in vitro and in vivo studies.Folia Microbiol (Praha). 2019 Mar;64(2):215-222. doi: 10.1007/s12223-018-0645-9. Epub 2018 Sep 19. Folia Microbiol (Praha). 2019. PMID: 30232727
-
Effect of Probiotics on Oral Candidiasis: A Systematic Review and Meta-Analysis.Nutrients. 2019 Oct 14;11(10):2449. doi: 10.3390/nu11102449. Nutrients. 2019. PMID: 31615039 Free PMC article.
References
-
- Harriott MM, Noverr MC. Importance of Candida-bacterial polymicrobial biofilms in disease. Trends Microbiol 2011; 19:557-63; PMID:21855346; http://dx.doi.org/10.1016/j.tim.2011.07.004 - DOI - PMC - PubMed
-
- Silverman RJ, Nobbs AH, Vickerman MM, Barbour ME, Jenkinson HF. Interaction of Candida albicans cell wall Als3 protein with Streptococcus gordonii SspB adhesin promotes development of mixed-species communities. Infect Immun 2010; 78:4644-52; PMID:20805332; http://dx.doi.org/10.1128/IAI.00685-10 - DOI - PMC - PubMed
-
- Ten Cate JM, Klis FM, Pereira-Cenci T, Crielaard W, de Groot PW. Molecular and cellular mechanisms that lead to Candida biofilm formation. J Dent Res 2009; 88:105-15; PMID:19278980; http://dx.doi.org/10.1177/0022034508329273 - DOI - PubMed
-
- Farah CS, Lynch N, McCullough MJ. Oral fungal infections: an update for the general practitioner. Aust Dent J 2010; 55:48-54; PMID:20553244; http://dx.doi.org/10.1111/j.1834-7819.2010.01198.x - DOI - PubMed
-
- Niimi M, Firth NA, Cannon RD. Antifungal drug resistance of oral fungi. Odontology 2010; 98:15-25; PMID:20155503; http://dx.doi.org/10.1007/s10266-009-0118-3 - DOI - PubMed
Publication types
MeSH terms
LinkOut - more resources
Full Text Sources
Other Literature Sources
Molecular Biology Databases
