. 2015 Feb 5;11(2):e1004093.
doi: 10.1371/journal.pcbi.1004093. eCollection 2015 Feb.

HIV competition dynamics over sexual networks: first comer advantage conserves founder effects

Affiliations

HIV competition dynamics over sexual networks: first comer advantage conserves founder effects

Bence Ferdinandy et al. PLoS Comput Biol. .

Abstract

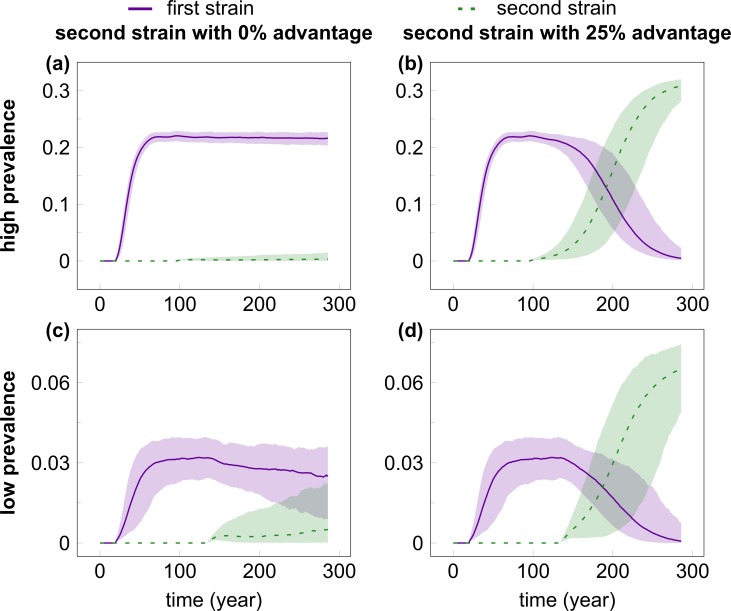
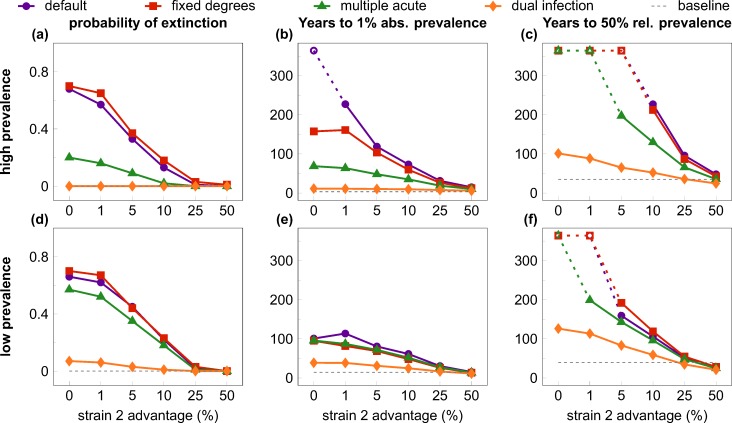
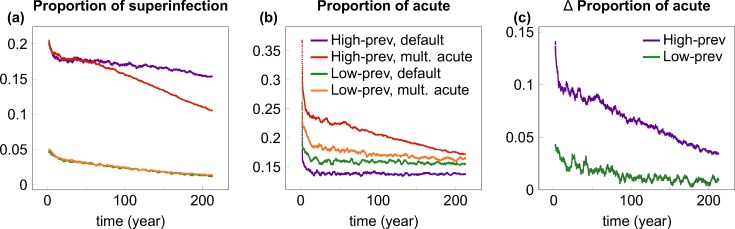
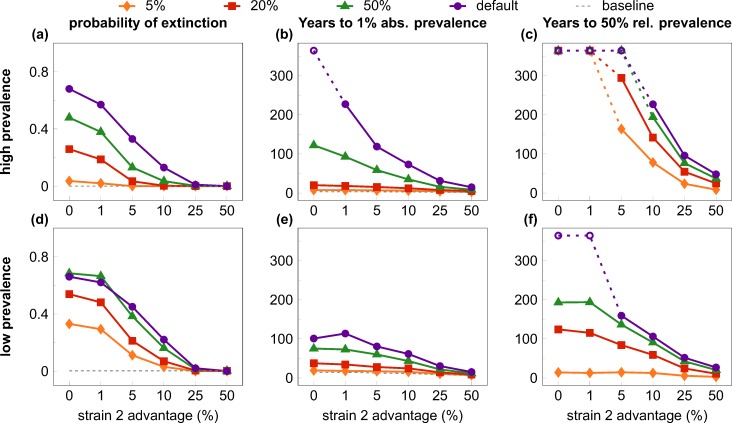
Outside Africa, the global phylogeography of HIV is characterized by compartmentalized local epidemics that are typically dominated by a single subtype, which indicates strong founder effects. We hypothesized that the competition of viral strains at the epidemic level may involve an advantage of the resident strain that was the first to colonize a population. Such an effect would slow down the invasion of new strains, and thus also the diversification of the epidemic. We developed a stochastic modelling framework to simulate HIV epidemics over dynamic contact networks. We simulated epidemics in which the second strain was introduced into a population where the first strain had established a steady-state epidemic, and assessed whether, and on what time scale, the second strain was able to spread in the population. Simulations were parameterized based on empirical data; we tested scenarios with varying levels of overall prevalence. The spread of the second strain occurred on a much slower time scale compared with the initial expansion of the first strain. With strains of equal transmission efficiency, the second strain was unable to invade on a time scale relevant for the history of the HIV pandemic. To become dominant over a time scale of decades, the second strain needed considerable (>25%) advantage in transmission efficiency over the resident strain. The inhibition effect was weaker if the second strain was introduced while the first strain was still in its growth phase. We also tested how possible mechanisms of interference (inhibition of superinfection, depletion of highly connected hubs in the network, one-time acute peak of infectiousness) contribute to the inhibition effect. Our simulations confirmed a strong first comer advantage in the competition dynamics of HIV at the population level, which may explain the global phylogeography of the virus and may influence the future evolution of the pandemic.


Conflict of interest statement

The authors have declared that no competing interests exist.

Figures

Fig 1
Fig 1. The time course of infection prevalence in multiple simulations of the competition of HIV strains.
The invader virus had equal (A, C) or 25% greater (B, D) transmission rate compared with the resident strain in the high (A, B) or low (C, D) prevalence scenarios. The resident strain (solid purple line) was introduced in the population at Week 1000 (to allow the network to attain steady state); the invader strain (dashed green line) was introduced in the population when the first had already reached steady-state prevalence (at Week 5000 and 7000 for the high- and low-prevalence setting, respectively). Even with a 25% advantage in the transmission rate, it took the invader strain a median of 60 and 104 years to reach the prevalence of the resident strain in the low- and high-prevalence scenario, respectively. The lines show median prevalence from simulations where the invader strain did not go extinct (out of 1000 simulation runs); shading indicates the areas between the 5% and 95% quantiles. Simulation parameters were set as in Table 1.
Fig 2
Fig 2. Preferential infection and killing of highly promiscuous individuals.
(A) The ratio of infection among men (purple dots) and (non-FSW) women (green squares) increased with preferred contact degree (number of partners per year; plotted on logarithmic scale). The plot was created from 1000 independent simulation runs of single-strain epidemics of high prevalence, using logarithmic binning, right-censored at the top 1% of the male/female population (where rare classes result in strong stochastic variation). (B) The frequency distribution of the annual number of sexual contacts (realized contact degree) of males in uninfected populations (purple dots) and in populations with high-prevalence epidemics (green squares), based on median data from 1000 simulation runs. Highly promiscuous individuals were selectively depleted in the presence of the virus. (C) Boxplot of the exponents of power-law distributions fitted to male individuals in batches of 1000 independent runs with no virus, low and high prevalence epidemics, respectively. Boxes depict interquartile range, median is indicated by horizontal lines within the boxes, and whiskers extend to the farthest values that are not more than 1.5 times the box width away from the box. Medians (and IQR) of the exponents were 2.59 (2.56–2.62), 2.70 (2.67–2.75) and 2.85 (2.81–2.90) in the absence of the virus and with low or high prevalence epidemics, respectively; all pairwise comparisons between the three scenarios were statistically significant (p<10–10; Wilcoxon rank sum test). Selective depletion among females is shown in S4 Fig. Simulation parameters were set as in Table 1.
Fig 3
Fig 3. Quantifiers of the “first comer advantage”.
All quantifiers are plotted against the relative transmission rate advantage of the second (invader) strain, with alternative scenarios to test interference mechanisms. Rows show results from the high (top row) and low prevalence (bottom row) settings; columns depict three different quantifiers; scenarios are coded by symbols and colour. In the default scenario (purple lines and dots) the invader strain faced a high risk of extinction (A, D) and experienced very slow growth to 1% absolute prevalence (B, E) and to 50% relative prevalence (C, F) at low values of transmission rate advantage, compared with the initial growth of the resident virus (dashed gray lines). The effect was largely abrogated with unhindered superinfection and co-existence (dual infection scenario; orange lines and diamonds), and, in the high-prevalence setting, partially mitigated by allowing for repeated “acute stage” peak infectivity after superinfection (multiple acute scenario; green lines and triangles); fixing the degree distribution of the contact network (fixed degrees scenario; red lines and squares) had little effect compared with the default scenario. Increasing the relative transmission rate advantage of the invader strain also decreased the inhibition effects: values comparable to the single-strain baseline were observed around 25%-50% transmission advantage. Data in B-C and E-F depict medians from 1000 simulation runs (excluding those where the invader virus went extinct). Parameters are listed in Table 1; scenarios are described in detail in the main text. The maximum length of simulations was 19,000 weeks (~365 years); empty symbols indicate where the invader strain did not reach the threshold prevalence by the end of the simulation in the majority of the cases.
Fig 4
Fig 4. The contribution of superinfection events and acute-stage transmissions to the spread of the invader strain.
(A) depicts the time course of the proportion of transmissions of the invader strain that involved superinfection of carriers of the resident virus. Coloured lines show smoothed proportion data for low and high prevalence epidemics using the default scenario, and the “multiple acute” scenario that allowed for repeated peaks of acute-stage infectiousness upon superinfection. In both scenarios, the contribution of superinfection was very low in the low-prevalence setting (green and orange lines), where most individuals were uninfected at the introduction of the invader strain; in contrast, many more transmissions involved superinfection in the high-prevalence setting (purple and red lines). (B) depicts the time course of the proportion of transmissions of the invader strain that originated from acute-stage transmitters in the four cases (colour coding is the same in A and B). (C) shows the difference in the proportion of acute-stage transmissions between the default and the multiple acute scenario for both prevalence settings (i.e. the distance between the red and purple, and between the green and yellow lines of Panel B). Allowing for multiple acute peaks of infectiousness greatly increased the proportion of acute-stage transmissions in the high-prevalence setting (purple line), but to a much lesser extent in the low-prevalence setting (green line). In all cases, time courses are plotted from the introduction of the invader strain into steady-state epidemics of the resident strain. Proportion data were calculated by combining transmission events recorded in 1000 simulation runs, then smoothed by averaging with a sliding window of length 100 weeks. Parameters were set as in Table 1; the transmission advantage of the invader strain was 5% in all cases.
Fig 5
Fig 5. Quantifiers of the “first comer advantage” when the invader virus enters in the growth phase of the resident strain.
Plotted are cases (coded by symbols and colour) where the invader was introduced when the resident strain had attained 5%, 20% or 50% of its plateau prevalence; in the default case the second virus was introduced at Week 7000/5000 in the low/high prevalence setting (as in Fig. 3) when the resident strain had already reached a stable plateau in its prevalence. All quantifiers are plotted against the relative transmission rate advantage of the second (invader) strain. Rows show results from the high (top row) and low prevalence (bottom row) settings; columns depict three different quantifiers. First comer advantage is weaker when the invader enters at earlier stages of the growth of the initial strain. Dashed gray lines in A-B and D-E represent the growth of the resident virus without competition; with early introduction of the invader strain, 50% relative prevalence in C and F is attained well below plateau prevalence and therefore cannot be compared to the 50% point of single-virus epidemics as a baseline. Data in B-C and E-F depict medians from 1000 simulation runs (excluding those where the invader virus went extinct). Parameters are listed in Table 1; competition dynamics followed the default scenario in all cases. The maximum length of simulations was 19,000 weeks (~365 years); empty symbols indicate where the invader strain did not reach the threshold prevalence by the end of the simulation in the majority of the cases.

Similar articles

Cited by

References

    1. Korber B, Muldoon M, Theiler J, Gao F, Gupta R, et al. (2000) Timing the ancestor of the HIV-1 pandemic strains. Science 288: 1789–1796. - PubMed
    1. Worobey M, Gemmel M, Teuwen DE, Haselkorn T, Kunstman K, et al. (2008) Direct evidence of extensive diversity of HIV-1 in Kinshasa by 1960. Nature 455: 661–664. 10.1038/nature07390 - DOI - PMC - PubMed
    1. Rambaut A, Robertson DL, Pybus OG, Peeters M, Holmes EC (2001) Human immunodeficiency virus. Phylogeny and the origin of HIV-1. Nature 410: 1047–1048. - PubMed
    1. Tebit DM, Arts EJ (2011) Tracking a century of global expansion and evolution of HIV to drive understanding and to combat disease. Lancet Infect Dis 11: 45–56. 10.1016/S1473-3099(10)70186-9 - DOI - PubMed
    1. Hemelaar J, Gouws E, Ghys PD, Osmanov S, Isolation W-UNfH, et al. (2011) Global trends in molecular epidemiology of HIV-1 during 2000–2007. AIDS 25: 679–689. 10.1097/QAD.0b013e328342ff93 - DOI - PMC - PubMed

Publication types