. 2015 Feb 5;56(3):1437-46.
doi: 10.1167/iovs.14-16126.

Mitochondrial morphology differences and mitophagy deficit in murine glaucomatous optic nerve

Affiliations

Mitochondrial morphology differences and mitophagy deficit in murine glaucomatous optic nerve

Lucy Coughlin et al. Invest Ophthalmol Vis Sci. .

Abstract

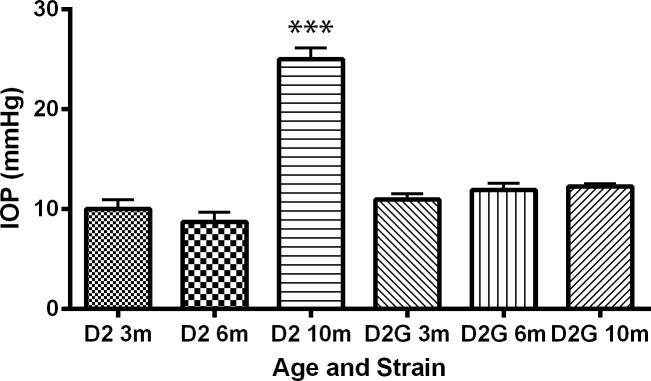
Purpose: Decreased ATP correlates with intraocular pressure exposure in the optic nerves of mice with glaucoma. To understand what underlies this energy deficit, we examined mitochondria in the myelinated optic nerve axons of the DBA/2J mouse, a model of glaucoma secondary to iris pigment disease, and the DBA/2(wt-gpnmb) control strain.

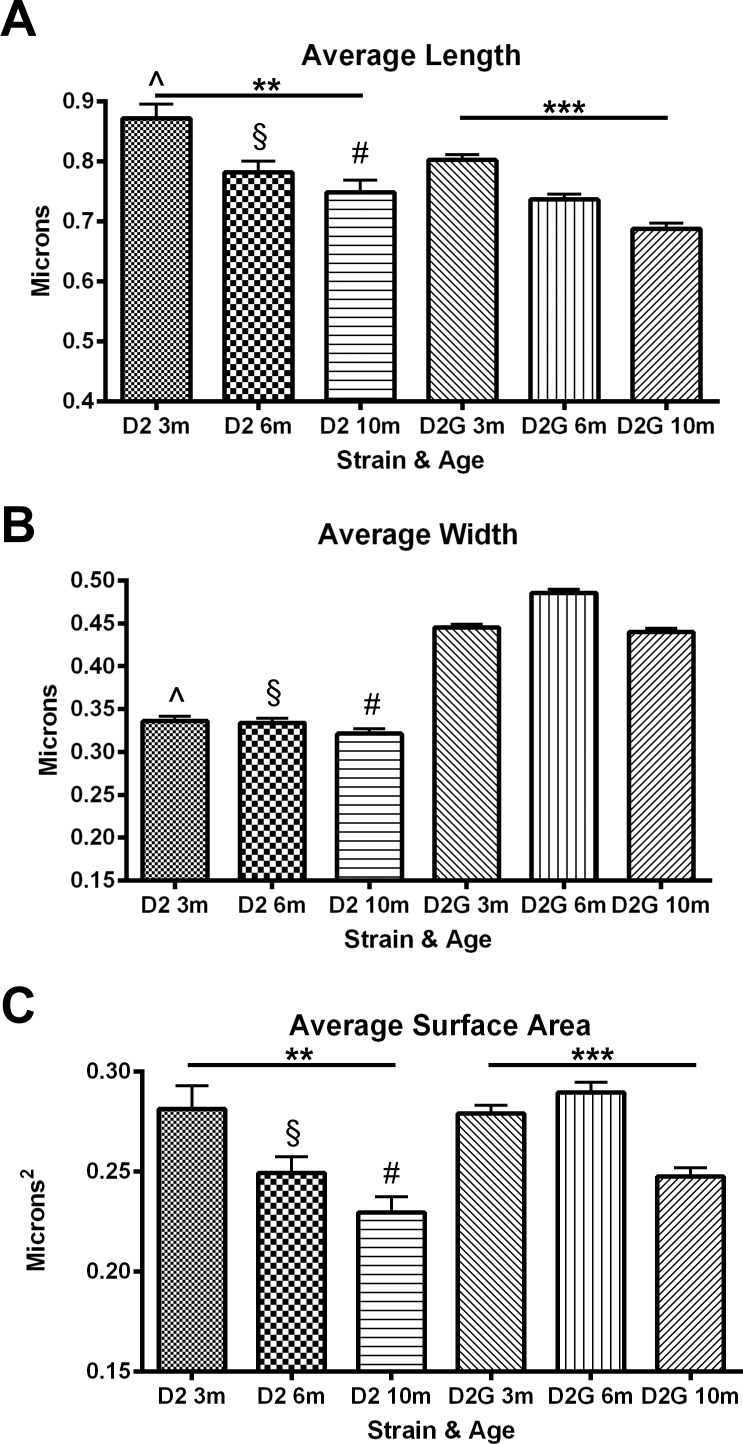
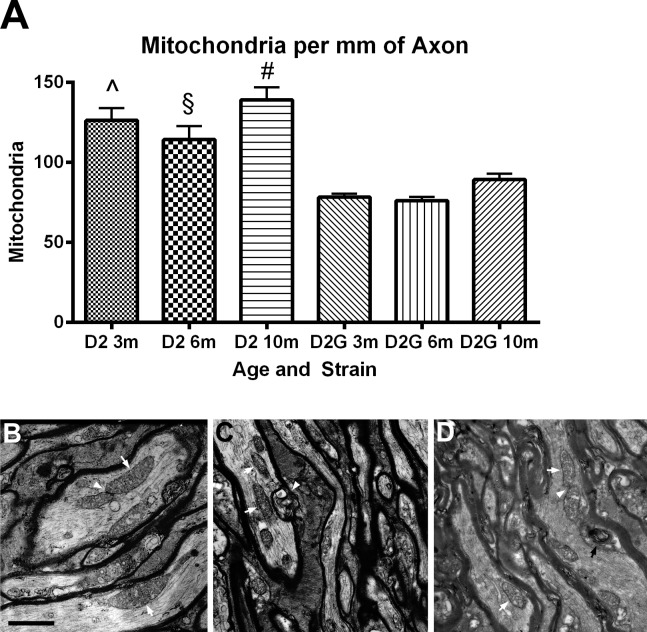
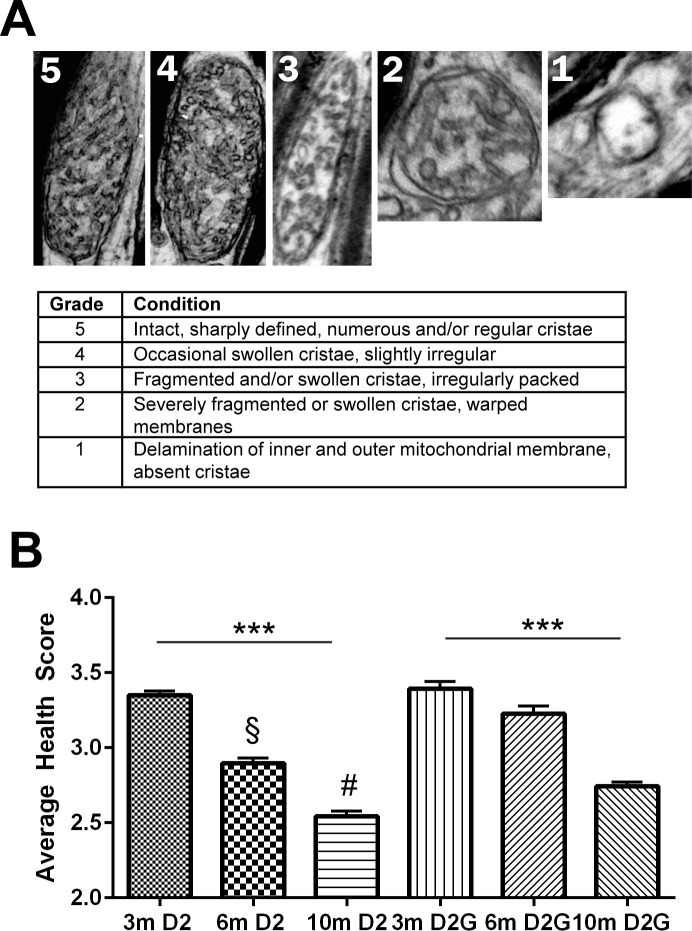
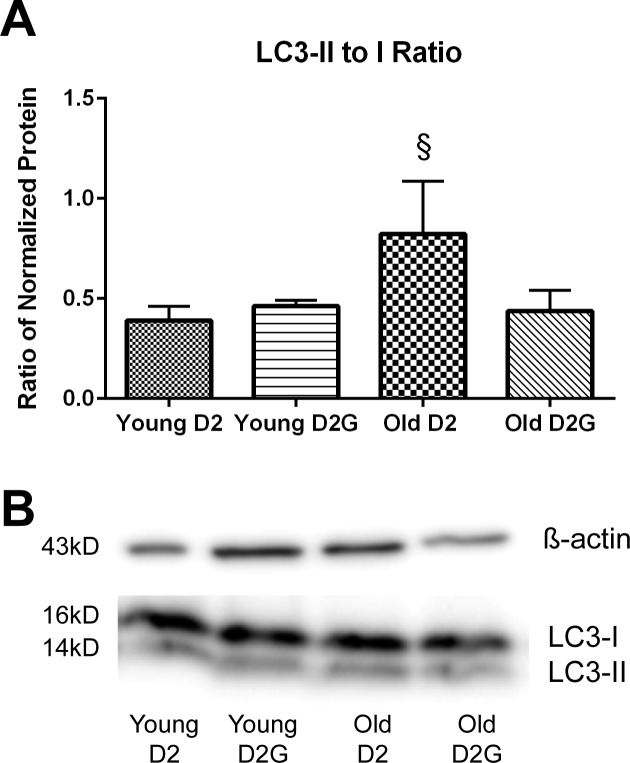
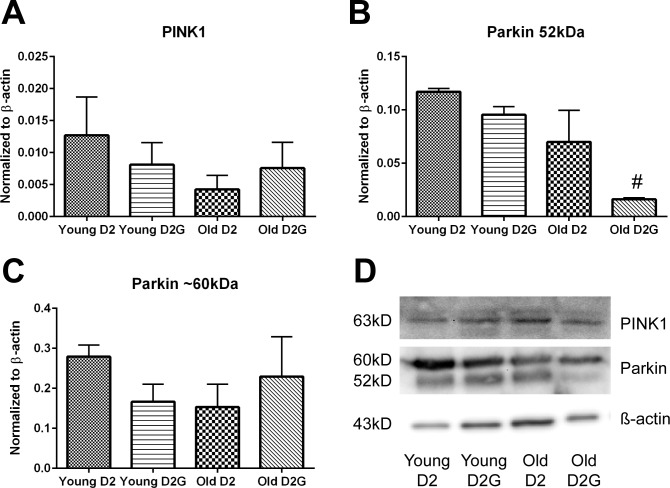
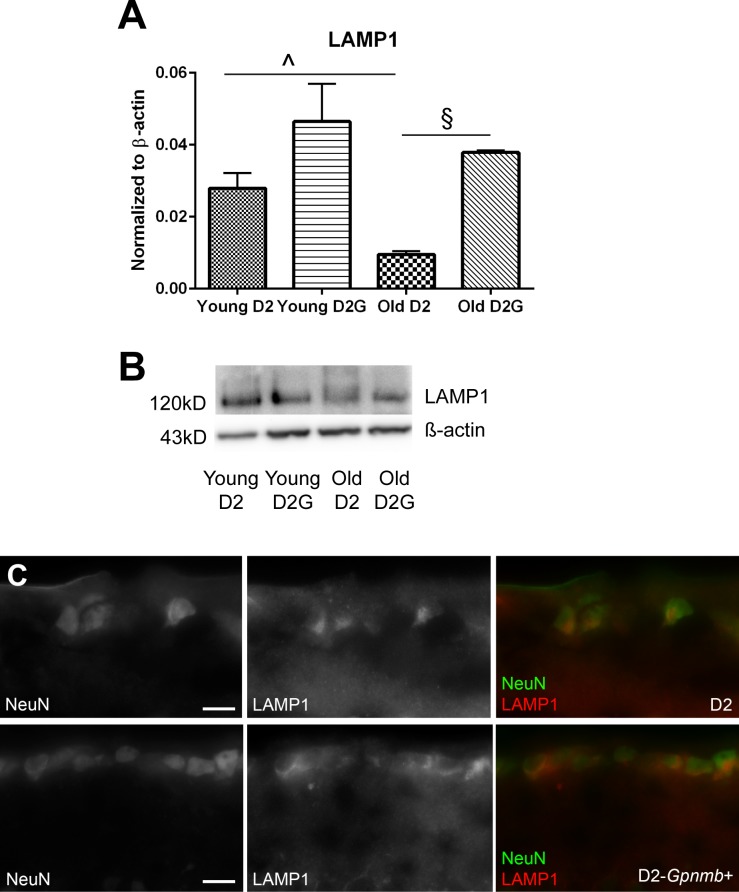
Methods: Mitochondrial length, width, surface area, and health status were measured in 30 electron microscopic fields within the myelinated portion of optic nerves from DBA/2J and DBA/2(wt-gpnmb) mice at 3, 6, and 10 months of age. Protein was isolated from optic nerve for analysis of PINK1, Parkin, LC3-I and -II, and lysosome-associated membrane protein 1 (LAMP1) by Western blot.

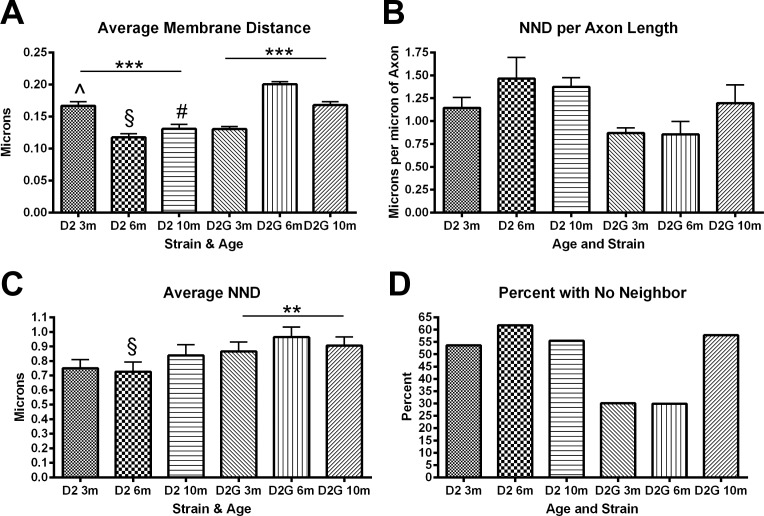
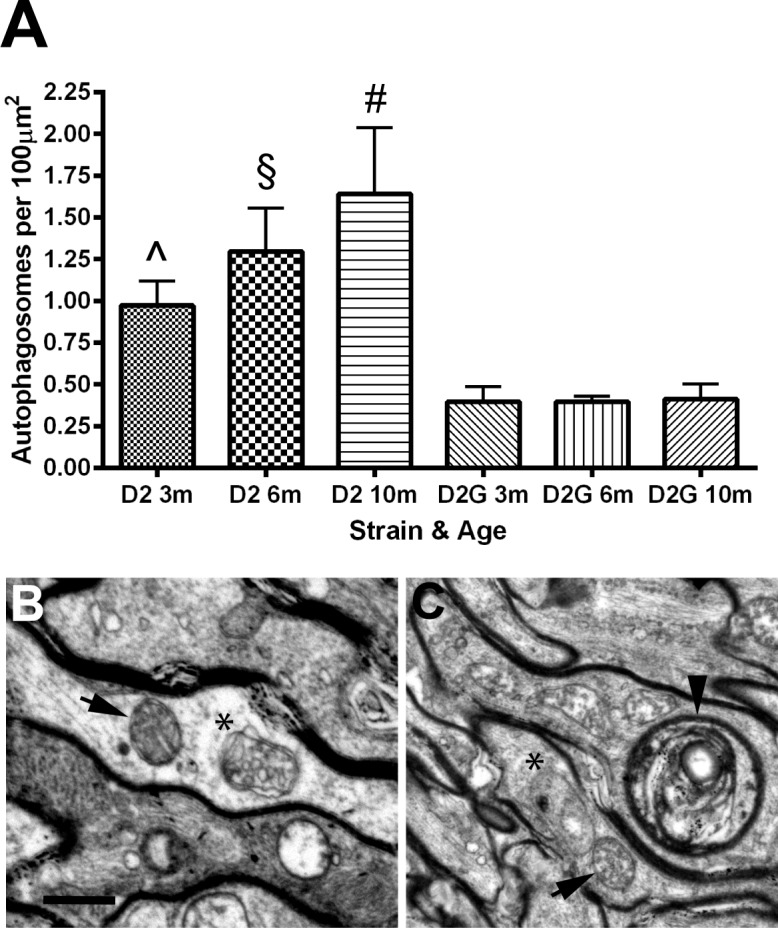
Results: The number of mitochondria in DBA/2J optic nerve was increased, and they had significantly smaller surface area. Mitochondria in DBA/2J were closer to the axolemma, more spatially isolated, and their cristae were more disrupted at every age group as compared to DBA/2(wt-gpnmb). Autophagosomes were significantly increased in DBA/2J optic nerve at all ages. Protein analysis showed higher LC3-II to LC3-I ratio in aged DBA/2J optic nerve than in DBA/2(wt-gpnmb). PINK1 and Parkin levels were not statistically different across age groups. LAMP1 was significantly decreased in the aged DBA/2J optic nerve.

Conclusions: Decreased surface area, combined with reduced oxidative capacity in mitochondria from the aged DBA/2J axon, indicate that mitochondrial pathology may contribute to the energy deficit in glaucomatous optic nerve. Though autophagosomes were increased in DBA/2J optic nerve, the increased mitochondria and decreased LAMP1 suggest deteriorating mitochondria are not being efficiently recycled by mitophagy.

Keywords: autophagosome; mitochondria; mitophagy.


Figures

Figure 1
Figure 1
Final IOP measured in eyes used for EM, left and right eyes averaged together, n = 4 for each age group and strain. Final IOP for DBA/2 mice (D2) at 10 months is significantly greater than that of age-matched control (D2G) at 10 months; ***P < 0.0001. Error bars: SD.
Figure 2
Figure 2
(AC) Averaged mitochondrial measures in D2 versus D2G ON (optic nerve) at 3, 6 and 10 months of age. (A) Mitochondrial length decreased significantly with age in both D2 and D2G (ANOVA **P < 0.0055 and ***P < 0.0001, respectively). t-tests indicate that each D2 length average is significantly greater than its corresponding D2G age group (3 months, ^P < 0.0011; 6 months, §P < 0.028; 10 months, #P < 0.0056). (B) Mitochondria were significantly wider in D2G than D2 ON (t-test, 3 months, ^P < 0.0001; 6 months, §P < 0.0001; 10 months, #P < 0.0001). (C) Mitochondrial area was calculated by using length, width, and the equation for area of an ellipse (see Methods). Average mitochondria area decreased significantly in D2 ON (ANOVA, **P < 0.0074) and changed significantly in D2G ON (ANOVA, ***P < 0.0001). t-tests indicate that D2 area averages are significantly lower for D2G area at 6 months (§P < 0.0001) and 10 months (#P < 0.04). Error bars: SD.
Figure 3
Figure 3
(A) D2 ON has significantly more mitochondria per millimeter of axon at each age group than D2G ON (t-tests, 3 months, ^P < 0.001; 6 months, §P < 0.001; 10 months, #P < 0.001). Error bars = SD. (BD) D2 ON micrographs. Scale bar: 500 nm. (B) Three-month ON has abundant mitochondria (arrows) and an example of a possible fusion or fission event (arrowhead). (C) Six-month ON shows mitochondria (arrows) in close proximity to a multilamellar organelle, possibly an autophagic vacuole (white arrowhead). (D) Ten-month ON has mitochondria (arrows) and a possible fusion or fission event (arrowhead) not far from an autophagic vacuole (black arrow).
Figure 4
Figure 4
(A) Mitochondria undergo significant changes in distance from the axon membrane across age in both D2 and D2G ON (ANOVA, ***P < 0.0001). Membrane distance is significantly different at each age group in D2 versus D2G (t-tests, 3 months, ^P < 0.0001; 6 months, §P < 0.0001; 10 months, #P < 0.0001). (B) Nearest neighbor distance, the distance between two mitochondria within an axon, varies across age and strain, but not in a statistically significant way. Data are represented as distance per micrometer of axon to correct for differences in axon length. (C) Average NND varies significantly across age in the D2G ON (ANOVA, P = 0.0044). At 6 months, NND is significantly lower in D2 ON (t-test, P = 0.0123). (D) More than 50% of D2 mitochondria were observed to be the only mitochondria within the axon in the EM field. D2G mitochondria have adjacent mitochondria 70% of the time until 10 months of age. Error bars: SD.
Figure 5
Figure 5
(A) Mitochondrial health scale is based primarily on cristae appearance. Grade of 5 is completely intact inner and outer membrane with regularly packed cristae. Grades 4 through 2 are decreasing levels of cristae preservation, and grade 1 represents missing cristae and breached inner or outer membrane. (B) Average health score for D2 glaucoma and D2G control ON mitochondria. Within-strain ANOVA indicates significant decrease in mitochondrial health from 3 to 10 months in both the D2 and the D2G (***P < 0.0001). Six-month D2 mitochondria have significantly poorer health scores than D2G (§P < 0.0001), as do 10-month D2 mitochondria (#P < 0.0001). Error bars: SD.
Figure 6
Figure 6
(A) Number of autophagosomes in axons per 100 μm2 of optic nerve area. D2 ON has significantly greater numbers of autophagosomes than the age-matched D2G ON (two-tailed t-tests; 3 months, ^P < 0.01; 6 months, §P < 0.005; 10 months, #P < 0.03). There is no statistical difference across age groups in the D2G ON. Error bars = SD. (B, C) Autophagosomes (*) adjacent to mitochondria (black arrows) in optic nerve. Arrowhead in (C) points to a multilamellar autophagic vesicle adjacent to multiple mitochondria (above left). Scale bar: 500 nm.
Figure 7
Figure 7
Ratio of LC3-II to LC3-I protein levels in D2 and D2G ON. LC3-I is conjugated to phosphatidylethanolamine to form LC3-II, and LC3-II remains with the autophagosome until lysosomal fusion. (A) The ratio of LC3-II to LC3-I is stable across young D2 and D2G ON and does not increase in old D2G ON (10 months). LC3-II to LC3-I ratio is significantly increased in old D2 ON (§P = 0.034, t-test) compared to old D2G ON, indicating greater conjugation of LC3-I to LC3-II. Scale bars: SEM. (B) Representative immunoblot bands for LC3-I and LC3-II (top) and β-actin (below). Bands are in identical order to graphs.
Figure 8
Figure 8
(A) PINK1 protein levels in young (2–4 months) and old (9–11 months) D2 and D2G ON. (B, C) Parkin protein levels in young and old D2 and D2G ON. There are several Parkin isoforms. Optic nerve homogenate yielded two bands, one at roughly 60 kDa and the other canonical band at 52 kDa. Parkin 60-kDa protein was significantly decreased in old D2G compared to young D2G ON (#P = 0.0024, t-test). Error bars: SEM (AC). (D) Representative bands from immunoblots. Bands are in identical order to graphs.
Figure 9
Figure 9
(A) Protein levels for LAMP1 in optic nerve. LAMP1 protein was significantly decreased in the old D2 ON compared to young D2 ON (^P = 0.029, t-test) and compared to old D2G ON (§P = 0.0048, t-test). Scale bar: SEM. (B) Representative bands from LAMP1 Western blot; upper bands are LAMP1 and lower bands are β-actin. Bands are in identical order to graphs. (C) Sagittal retinal sections from old (10–11 month) D2 and D2-Gpnmb+ mice were immunolabeled with antibodies against NeuN (green) and LAMP1 (red). Photomicrographs depict the ganglion cell layer and inner plexiform layer. Scale bars: 25 μm.

References

    1. Banitt MR, Ventura LM, Feuer WJ, et al. Progressive loss of retinal ganglion cell function precedes structural loss by several years in glaucoma suspects. Invest Ophthalmol Vis Sci. 2013; 54: 2346–2352. - PMC - PubMed
    1. Saleh M, Nagaraju M, Porciatti V. Longitudinal evaluation of retinal ganglion cell function and IOP in the DBA/2J mouse model of glaucoma. Invest Ophthalmol Vis Sci. 2007; 48: 4564–4572. - PMC - PubMed
    1. Baltan S, Inman DM, Danilov C, Morrison RS, Calkins DJ, Horner PJ. Metabolic vulnerability disposes retinal ganglion cell axons to dysfunction in a model of glaucomatous degeneration. J Neurosci. 2010; 30: 5644–5652. - PMC - PubMed
    1. Zhang CL, Ho PL, Kintner DB, Sun D, Chiu SY. Activity-dependent regulation of mitochondrial motility by calcium and Na/K-ATPase at nodes of Ranvier of myelinated nerves. J Neurosci. 2010; 30: 3555–3566. - PMC - PubMed
    1. Buckingham BP, Inman DM, Lambert WS, et al. Progressive ganglion cell degeneration precedes neuronal loss in a mouse model of glaucoma. J Neurosci. 2008; 28: 2735–2744. - PMC - PubMed

Publication types

Substances