. 2015 Apr 1;593(7):1551-80.
doi: 10.1113/jphysiol.2014.280826. Epub 2015 Feb 6.

Dorsoventral differences in Kv7/M-current and its impact on resonance, temporal summation and excitability in rat hippocampal pyramidal cells

Affiliations

Dorsoventral differences in Kv7/M-current and its impact on resonance, temporal summation and excitability in rat hippocampal pyramidal cells

Christoph Hönigsperger et al. J Physiol. .

Abstract

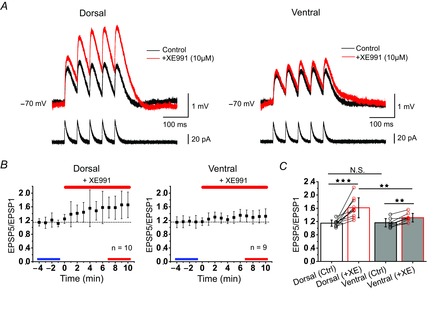
In rodent hippocampi, the connections, gene expression and functions differ along the dorsoventral (D-V) axis. CA1 pyramidal cells show increasing excitability along the D-V axis, although the underlying mechanism is not known. In the present study, we investigated how the M-current (IM ), caused by Kv7/M (KCNQ) potassium channels, and known to often control neuronal excitability, contributes to D-V differences in intrinsic properties of CA1 pyramidal cells. Using whole-cell patch clamp recordings and the selective Kv7/M blocker 10,10-bis(4-pyridinylmethyl)-9(10H)-anthracenone dihydrochloride (XE991) in hippocampal slices from 3- to 4-week-old rats, we found that: (i) IM had a stronger impact on subthreshold electrical properties in dorsal than ventral CA1 pyramidal cells, including input resistance, temporal summation of artificial synaptic potentials, and M-resonance; (ii) IM activated at more negative potentials (left-shifted) and had larger peak amplitude in the dorsal than ventral CA1; and (iii) the initial spike threshold (during ramp depolarizations) was elevated, and the medium after-hyperpolarization and spike frequency adaptation were increased (i.e. excitability was lower) in the dorsal rather than ventral CA1. These differences were abolished or reduced by application of XE991, indicating that they were caused by IM . Thus, it appears that IM has stronger effects in dorsal than in ventral rat CA1 pyramidal cells because of a larger maximal M-conductance and left-shifted activation curve in the dorsal cells. These mechanisms may contribute to D-V differences in the rate and phase coding of position by CA1 place cells, and may also enhance epileptiform activity in ventral CA1.


Figures

Figure 1
Figure 1
Characterization of input resistance (RInput), membrane potential sag and rebound potential in dorsal and ventral pyramidal cells A, example traces of voltage responses evoked by 1 s long current pulses (−100 pA, +50 pA) in dorsal (n = 22) and ventral (n = 25) pyramidal cells. B, summary, RInput was significantly higher for both negative and positive current pulses in ventral pyramidal cells [–100 pA: 92.3 (26.2) MΩ; +50 pA: +137.8 (40.1) MΩ; n = 25 cells; N = 17 rats] than dorsal pyramidal cells [–100 pA: 70 (17.9) MΩ; +50 pA: 107.4 (33.4) MΩ; n = 22 cells; N = 15 rats]; *P < 0.05, **P < 0.01. RInput was significantly higher during positive than negative pulses in both ventral and dorsal cells (***P < 0.001; two-way repeated measures ANOVA). C, example traces of voltage responses evoked by 1 s long negative current pulses in dorsal (n = 14) and ventral (n = 15) pyramidal cells. Injected current pulses were scaled to compare voltage responses at similar membrane potentials at the beginning of each pulse (• Peak) in dorsal and ventral pyramidal cells. D, summary, showing no significant difference in membrane potentials measured at the peak [dorsal: −81.6 (1.96) mV; n = 14 cells; N = 12 rats; ventral: −81.5 (1.94) mV; n = 15 cells; N = 12 rats; P = 0.97, two-tailed, two-sample t test after Johnson transformation] and at steady-state voltage responses (○) at the end of each pulse [dorsal: −80.1 (1.59) mV; ventral: −79.8 (1.315) mV; P = 0.64, two-tailed t test). To quantify the sag ratio, we divided steady-state voltage responses by responses measured at the peak, showing no difference between dorsal and ventral pyramidal cells [dorsal: 0.98 (0.007); ventral: 0.98 (0.014); P = 0.93, two-tailed, two-sample t test after Johnson transformation]. E, additional analysis showed no significant difference in mean rebound potentials (▪) measured after the end of each pulse in dorsal and ventral pyramidal cells [dorsal: −70.7 (0.9) mV; n = 14 cells; N = 12 rats; ventral: −70.4 (1.2) mV; n = 15 cells; N = 12 rats; P = 0.56, two-tailed, two-sample t test]. Mean (SD).
Figure 2
Figure 2
Three-dimensional reconstruction and morphological analysis of dorsal and ventral CA1 pyramidal cells Aa, Ba, reconstructed pyramidal cells from dorsal (n = 10 cells; N = 7 rats) and ventral CA1 (n = 10 cells; N = 6 rats). Axons are drawn in red; arrows indicate the end of the axon if it is not obvious. Scale bar = 100 μm. Asterisks (*) indicate cells with total dendritic length close to the mean of each population, shown at an expanded scale in C. Ab, Bb, show the positions of the reconstructed cells in the hippocampal slices. Scale bar = 1000 μm. C, representative examples of reconstructed pyramidal cells in dorsal and ventral CA1. Axons (red) were identified by lack of dendritic spines and presence of enlarged structures formed at the cut end (axonal blebs, see inset). Scale bar = 100 μm. D, the measured total dendritic length was greater in dorsal than ventral CA1 pyramidal cells [dorsal: 9.4 (1.86) mm; n = 10 cells; N = 7 rats; ventral: 7.11 (1.13) mm; n = 10 cells; N = 6 rats; **P < 0.01]. E, the apical dendritic length was not significantly different between dorsal and ventral pyramidal cells [dorsal: 6.43 (1.52) mm; ventral: 5.3 (1.14) mm; not significant, P = 0.076]. F, the basal dendritic length was significantly greater in dorsal than in ventral pyramidal cells [dorsal: 2.97 (0.90) mm; ventral: 1.81 (0.26) mm; **P < 0.01]. G, the total dendritic surface of pyramidal cells was significantly greater in dorsal compared to ventral pyramidal cells (dorsal: 18223 (6540) μm2; ventral: 12705 (3558) μm2; *P < 0.05). H, the total dendritic volume did not show a significant difference between dorsal and ventral pyramidal cells (dorsal: 3827 (1960) μm3; ventral: 2712 (1161) μm3; not significant, P = 0.135]. I, the total length of the (cut) axons was significantly greater in ventral than in dorsal pyramidal cells [dorsal: 0.22  (0.15) mm; ventral: 1.25 (0.68) mm]; ***P < 0.001) (two-tailed, two-sample t tests (after Box-Cox transformation in D, F, G, H, I). Mean (SD).
Figure 3
Figure 3
Effects of retigabine and XE991 on input resistance (RInput) in dorsal and ventral CA1 pyramidal cells A and B, representative sample traces of voltage responses evoked by a series of hyper- and depolarizing current pulses in a dorsal (A) and ventral (B) pyramidal cells. The membrane potential was pre-adjusted to −78 mV by direct current injection. TTX (0.5 μm) was applied during the whole recording period to avoid spiking. The traces illustrate typical voltage responses during control periods (black traces), after application of the Kv7 opener retigabine (10 μm) (green) and after application of the Kv7 blocker XE991 (10 μm) (red). Corresponding current-voltage (I–V) curves are shown to the right. C and D, left: overlay of single voltage responses (control: black; retigabine: green; XE991: red) to the same current pulse in a dorsal and a ventral pyramidal cell, respectively. Injected current pulses were adjusted, if necessary, to obtain the same membrane potential of −58 mV (dashed lines) at the end of each pulse during the control period in both dorsal and ventral cells for direct comparison. C and D, right: comparison between changes in RInput after application of retigabine and XE991. Dorsal cells: control: 98.7 (28.3) MΩ; retigabine: 66.9 (17.2) MΩ; XE991: 132.6 (41.6) MΩ; n = 5 cells; N = 4 rats; ***P < 0.001, **P < 0.01; Ventral cells: control: 76.6 (30.7) MΩ; retigabine: 63.2 (18.3) MΩ; XE991: 87.2 (24.7) MΩ; n = 5 cells; N = 4 rats; *P < 0.05, ***P < 0.001. RInput was not significantly different between dorsal and ventral cells in control, or after application of retigabine and XE991 (P = 0.17, P = 0.7, P = 0.1) (two-factor repeated measures ANOVA after Box-Cox transformation). Mean (SD).
Figure 4
Figure 4
Effect of XE991 on temporal summation in dorsal and ventral CA1 pyramidal cells A, overlay of representative somatic αEPSPs (mV, black: control, red: after XE991 application) after injection of five EPSCs at 20 Hz (pA). The initial membrane potential was adjusted to −70 mV. B, normalized time course of the effect of XE991 (10 μm) on EPSP summation (amplitude ratio of 5th EPSP/1st EPSP) in dorsal (left, n = 10 cells; N = 6 rats) and ventral (right, n = 9 cells; N = 6 rats) pyramidal cells. Steady-state responses are indicated for control (blue line, bottom) and after application of XE991 (red line, bottom). C, summary graph, comparing mean EPSP summation (blue, red lines in B), in dorsal pyramidal cells [control: 1.15 (0.09); after XE991: 1.61 (0.3); ***P < 0.001] and ventral pyramidal cells [control: 1.16 (0.13); after XE991: 1.32 (0.13); **P < 0.01]. EPSP summation was not significantly different between dorsal and ventral pyramidal cells in control [dorsal: 1.15 (0.09); ventral: 1.16 (0.13); not significant, P = 0.92] but was significantly higher in dorsal cells after application of XE991 [dorsal: 1.61 (0.3), ventral: 1.32 (0.13); **P < 0.01] (two-way repeated measures ANOVA after Box-Cox transformation). Mean (SD).
Figure 5
Figure 5
Kv7-dependent M-resonance close to spike threshold differs between dorsal and ventral CA1 pyramidal cells A, typical voltage responses (top) to sinusoidal current injections of linearly increasing frequency (ZAP protocol) (bottom) in dorsal and ventral pyramidal cells at −60 mV. AF, injected currents were scaled to yield initial voltage responses of similar amplitudes (∼1.5 mV). B, histograms showing distributions of resonance frequency in dorsal and ventral pyramidal cells. Arrows indicate location of example traces from (A). C, summary for all recorded cells, comparing resonance frequency [dorsal: 2.5 (1.6) Hz; n = 30 cells, N = 21 rats; ventral: 0.8 (1.2) Hz; n = 30 cells; N = 18 rats; **P < 0.01] and resonance strength (Q-value) [dorsal: 1.5 (0.4); n = 30 cells, N = 21 rats; ventral: 1.1 (0.3); n = 30 cells, N = 18 rats; **P < 0.01] (two-tailed, boot-strapped two-sample t tests). D, F, voltage responses of dorsal and ventral pyramidal cells to sinusoidal current injections in control (black) and after bath-application of XE991 (10 μm, red) and retigabine (10 μm, green) respectively. E, effects of XE991 on resonance frequency [control: 3.8 (1.6) Hz; after XE991: 0.2 (0.4) Hz; n = 6 cells; N = 4 rats; **P < 0.01] and resonance strength [Q-value; control: 1.7 (0.15); after XE991: 1.0 (0); n = 6 cells; N = 4 rats; **P < 0.01] in dorsal cells. G, effects of retigabine on resonance frequency [control: 0.7 (1.3) Hz; after retigabine: 4.6 (1.3) Hz; n = 6 cells; N = 6 rats; *P < 0.05] and Q-value [control: 1.04 (0.1); after retigabine: 2.05 (0.55); n = 6 cells; N = 6 rats; *P < 0.05] (two-tailed, boot-strapped paired t tests) in ventral cells. Mean (SD).
Figure 6
Figure 6
Voltage dependence of XE991-sensitive current in dorsal and ventral CA1 pyramidal cells A and B, somatic voltage-clamp recordings; slow depolarizing and repolarizing voltage ramps (8 mV s–1) evoked outward currents (black traces) in dorsal and ventral pyramidal cells which were partially blocked by XE991 (10–20 μm) (red traces). C and D, traces showing the subtracted XE991 sensitive outward currents (control − XE991, blue) from dorsal and ventral pyramidal cells in A and B. Recordings were made in the presence of Ca2+ free artificial cerebrospinal fluid substituted with MnCl2 (2 mm), and channel blockers TTX (0.5 μm), ZD7288 (10 μm) and 4-AP (1 mm). E, overlay of XE991 sensitive currents shown in C and D. Dashed vertical lines indicate the magnitude XE991 sensitive currents measured at a command membrane potential of −8.5 mV in dorsal and ventral pyramidal cells. The XE991 sensitive currents were fitted with Boltzmann functions and polynomial functions f(V) (black) separately shown as conductance–voltage (G–V) plots in I. F, close-up of fitted XE991 sensitive currents in E around the activation threshold (0 pA, horizontal dashed lines). Dashed vertical lines indicate the magnitude of XE991 sensitive currents at −60 mV. G, summary, comparing XE991 sensitive currents at a membrane potential of −8.5 mV [dorsal: 2845 (321) pA; n = 4 cells; N = 3 rats; ventral: 1146 (351) pA; n = 5 cells; N = 3 rats; ***P < 0.001] and in H, at −60 mV [dorsal: 90 (28.5) pA; n = 4 cells; N = 3 rats; ventral: 42.6 (28) pA; n = 5 cells; N = 3 rats; *P < 0.05] (two-tailed, boot-strapped two-sample t tests). One dorsal cell (marked by parentheses) was excluded from analysis, as explained in the methods. The values in H, are means from depolarizing and repolarizing XE991-subtracted ramp current at −60 mV. Mean (SD). I, GV plots of Boltzmann and polynomial f(V) fits (black) in dorsal (left) and ventral (right) cells. Solid and dashed lines show individual fits of depolarizing and repolarizing ramps respectively. The obtained Boltzmann parameters were used for the NEURON simulations shown in Fig. 7.
Figure 7
Figure 7
Simulation results for a NEURON compartmental model of a CA1 pyramidal cell (see Methods) (AD) and dependence of the experimentally detemined Bolzmann paramaters on preserved axon length in dorsal and ventral cells (EJ) AC, Effect of preserved axon length on Boltzmann parameters obtained from fits of eqn 2 to the predicted XE991-sensitive conductance, G(V) (as in D). The simulation regimes are defined in Table2; M-conductance (gM) gating was essentially instantaneous. D, model predictions for a dorsal cell (x = 100 μm, regime I) and fits of eqn 2 for a gM gating mechanism comprising fast and slow components (i.e. non-instantaneous gating). EJ, dependence of the experimentally determined Boltzmann parameters (Table1) on preserved axon length (x) in dorsal and ventral cells. Pearson product-moment correlation coefficients (r) and associated significance levels (P) are given, together with regression-line fits.
Figure 8
Figure 8
Dorsal and ventral pyramidal cells differ in spike threshold, mediated by Kv7 channels A and C, Voltage responses (mV) of dorsal and ventral pyramidal cells to injected slow current ramps (50 pA/10 s−1) in control (black) and after application of XE991 (red). B and D, dV/dt plots illustrate corresponding spike thresholds of the 1st spike (black, red arrowheads in A and C) in dorsal and ventral pyramidal cells. E and F, Enlarged dV/dt plots show that spike thresholds were measured when membrane potentials changed more than 10 mV ms-1 (dashed lines). G, summary: spike thresholds in dorsal and ventral pyramidal cells were significantly different in control [dorsal: −51.5 (3.0) mV; n = 7 cells; N = 5 rats; ventral: −56 (2.4) mV; n = 7 cells; N = 3 rats; *P < 0.05] but not after application of XE991 [dorsal: −54.1 (3.5) mV; ventral: −57.1 (2.4) mV; not significant, P = 0.08]. XE991 significantly changed spike thresholds in dorsal pyramidal cells (***P < 0.001) and in ventral pyramidal cells (**P < 0.01) (two-way repeated measures ANOVA). Mean (SD)
Figure 9
Figure 9
Dorsal and ventral pyramidal cells differ in the size of their Kv7-dependent medium mAHP following a spike train A and B, Typical recordings showing trains of five spikes followed by mAHPs (arrows), evoked by brief (50 ms) current pulses in a dorsal pyramidal cell (A) and in a ventral pyramidal cell (D) under normal conditions. The membrane potential before the stimulation was kept at −71 mV in both dorsal and ventral cells, by adjusting a steady, depolarizing holding current. For better isolation of the Kv7-dependent mAHP, an additional depolarizing DC current was injected after the stimulation. Application of XE991 (10 μm) reduced the mAHP more strongly in dorsal (B and C) than ventral (E and F) pyramidal cells. Note that current pulses were reduced after XE991 application to keep the number of spikes constant, and the DC holding current before the stimulation was reduced to keep the membrane potential at −71 mV. The depolarizing holding current after the stimulation was kept at the same level compared to control. G and H, Time plots showing the effect of XE991 application (10 min, red bars) on the mAHP peak (mV) in dorsal (n = 7 cells; N = 5 rats) and ventral (n = 7 cells; N = 5 rats) cells. I, summary, comparing the mAHP peak potential in control (blue lines in G and H) and the last 5 min during XE991 application (red lines in G and H) in dorsal cells [control: −68.9 (2.9) mV; after XE991: −64.8 (3.5) mV; n = 7 cells, N = 5 rats; ***P < 0.001] and ventral cells [control: −70.0 (2.0) mV; after XE991: −68.2 (3.5) mV; n = 7 cells; N = 5 rats; *P < 0.05]. The mAHP peak potential (mV) was not significantly different between dorsal and ventral cells in control (P = 0.7) and after application of XE991 (P = 0.056) (two-way repeated measures ANOVA). J, summary comparing the difference (Δ) in mAHP peak potentials before and after XE991 application between dorsal and ventral cells [dorsal: −4.1 (1.8) mV; n = 7 cells; ventral: −1.9 (1.6) mV; n = 7 cells; *P < 0.05] (two-tailed, boot-strapped two-sample t test). Mean (SD).
Figure 10
Figure 10
Kv7 channels contribute to differences in somatic excitability in dorsal and ventral CA1 pyramidal cells A, examples of spike trains (mV) in dorsal (top) and ventral pyramidal cells (bottom) evoked by injected current pulses (250 pA, 1 s). Spike rates (spikes s–1) recorded in control conditions (black traces) increased after application of XE991 (10 μm) (red traces) in dorsal and ventral pyramidal cells. B, left: summary graph comparing spike rates in control conditions plotted against a range of injected current pulses in dorsal (black squares) and ventral pyramidal cells (grey squares). Linear fits were used to compare slopes between dorsal and ventral f/I curves (from 50 pA to 250 pA). Slope, control: dorsal: 0.07 (0.03) spikes s–1 pA–1; n = 14 cells; N = 9 rats; ventral: 0.11 (0.03) spikes s–1 pA–1; n = 14 cells; N = 9 rats; **P < 0.01. B, right: after application of XE991, the difference in f/I slopes was abolished compared to control conditions. Slope, after XE991: dorsal: 0.12 (0.04) spikes s–1 pA–1; ventral: 0.14 (0.045) spikes s–1 pA–1; not significant, P = 0.1 (two-way repeated measures ANOVA after Box-Cox transformation). Mean (SD).
Figure 11
Figure 11
Spike rate adaptation is stronger in dorsal compared to ventral CA1 pyramidal cells and is partially mediated by Kv7 channels A, examples of somatically recorded spike trains (mV) in dorsal (top) and ventral (bottom) pyramidal cells during control conditions (black) and after bath application of XE991 (10 μm) (red) evoked by injecting 1 s current pulses. To compare spike rate adaptation before and after application of XE991, the amplitudes of injected current pulses were reduced to obtain similar initial spike rates. B, average spike rates for the 1st interspike interval (1/ISI1, spikes s–1) were not significantly different in control (dorsal: 57.9 (21.6) spikes s–1; n = 7 cells; N = 5 rats; ventral: 52.6 (19.7) spikes s–1; n = 7 cells; N = 5 rats; not significant P = 0.72) or after XE991 application [dorsal: 56.8 (23.1) spikes s–1; ventral: 53.4 (26.6) spikes s–1; not significant P = 0.95] (two-way repeated measures ANOVA). C, adaptation index (%) (see Methods) was significantly higher in dorsal than in ventral pyramidal cells in control conditions [dorsal: 86.1% (10.7%); n = 7 cells; N = 5 rats; ventral: 62.4% (17%); n = 7 cells; N = 5 rats; **P < 0.01]. XE991 significantly reduced the adaptation index in dorsal pyramidal cells [control: 86.1% (10.7%); after XE991: 77.2% (8.9%); **P < 0.01] but not ventral pyramidal cells [control: 62.4% (17%); after XE991: 62.1% (25%); not significant, P = 0.76]. After XE991 application, the adaptation index was not significantly different in dorsal and ventral pyramidal cells (not significant, P = 0.15) (two-way repeated measures ANOVA after Johnson transformation). Mean (SD).

Comment in

Similar articles

Cited by

References

    1. Adams PR, Brown DA. Constanti A. M-currents and other potassium currents in bullfrog sympathetic neurones. J Physiol. 1982;330:537–572. - PMC - PubMed
    1. Alle H, Ostroumov K, Geiger J. Storm JF. M-current, persistent Na+ current, and subthreshold resonance recorded in mossy fiber boutons. 2009. (MFBs) in rat hippocampus. Program No. 42.2/D10. 2009 Neuroscience Meeting Planner. Society for Neuroscience, Chicago, IL, USA. Online. Ref Type: Abstract.
    1. Amendola J, Woodhouse A, Martin-Eauclaire MF. Goaillard JM. Ca2+/cAMP-sensitive covariation of IA and IH voltage dependences tunes rebound firing in dopaminergic neurons. J Neurosci. 2012;32:2166–2181. - PMC - PubMed
    1. Azouz R. Gray CM. Dynamic spike threshold reveals a mechanism for synaptic coincidence detection in cortical neurons in vivo. Proc Natl Acad Sci USA. 2000;97:8110–8115. - PMC - PubMed
    1. Bannerman DM, Rawlins JNP, McHugh SB, Deacon RMJ, Yee BK, Bast T, Zhang WN, Pothuizen HHJ. Feldon J. Regional dissociations within the hippocampus – memory and anxiety. Neurosci Biobehav Rev. 2004;28:273–283. - PubMed

Publication types

MeSH terms

Substances

LinkOut - more resources