. 2015 Apr 15;308(8):F888-98.
doi: 10.1152/ajprenal.00624.2014. Epub 2015 Feb 4.

Fgfr2 is integral for bladder mesenchyme patterning and function

Affiliations

Fgfr2 is integral for bladder mesenchyme patterning and function

K A Walker et al. Am J Physiol Renal Physiol. .

Retraction in

  • Retraction.
    [No authors listed] [No authors listed] Am J Physiol Renal Physiol. 2016 Jul 1;311(1):F239. doi: 10.1152/ajprenal.zh2-7964-retr.2016. Am J Physiol Renal Physiol. 2016. PMID: 27390325 Free PMC article. No abstract available.

Abstract

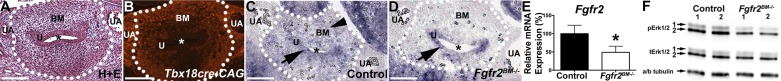
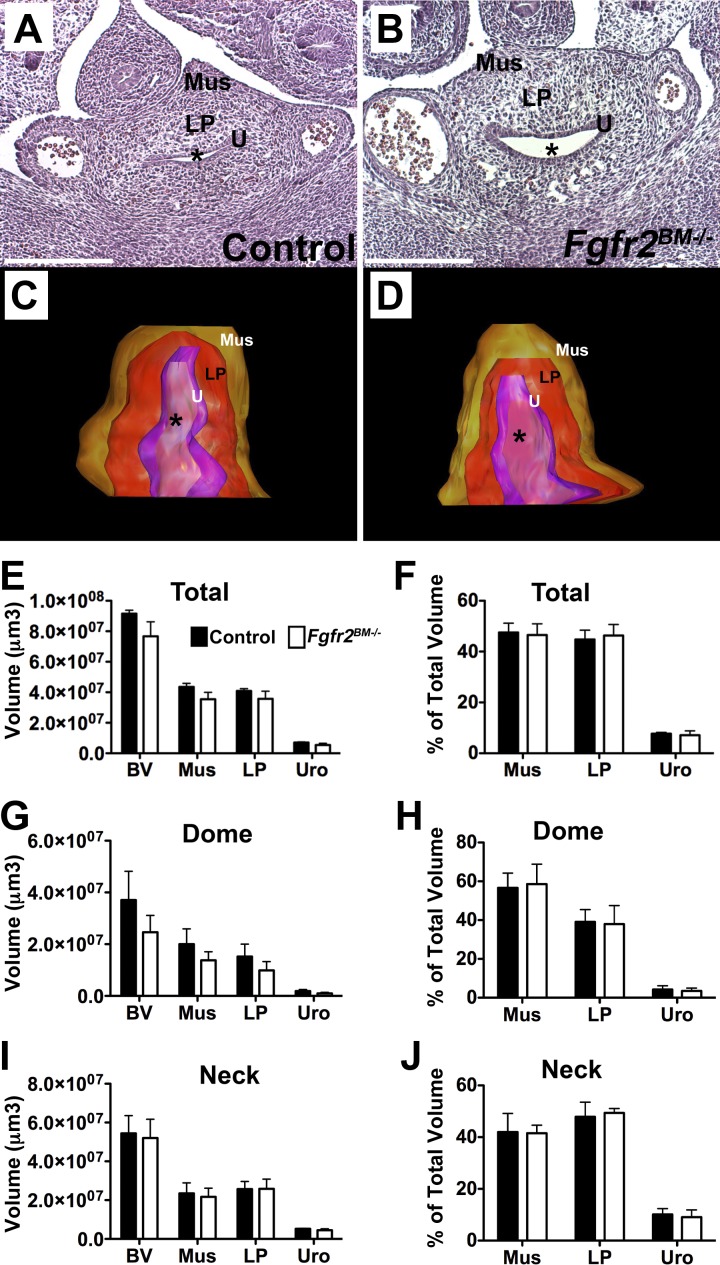
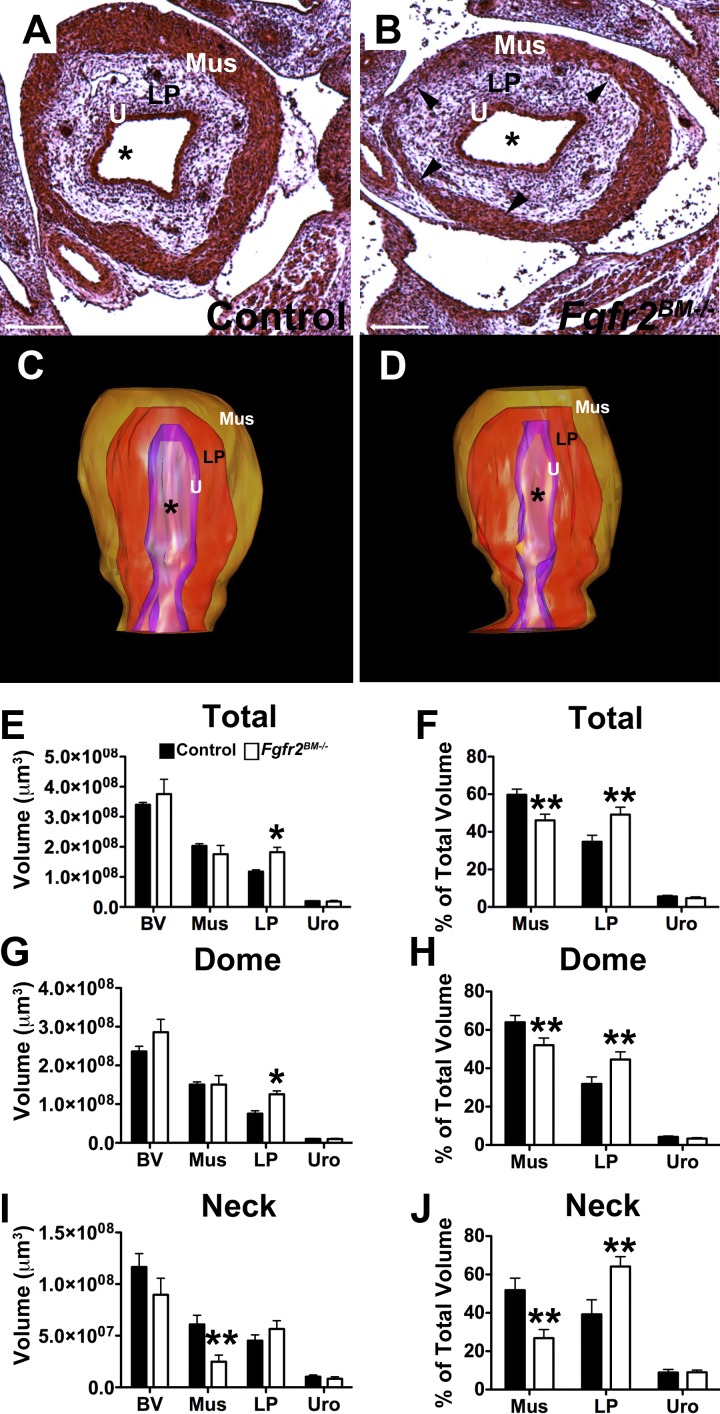
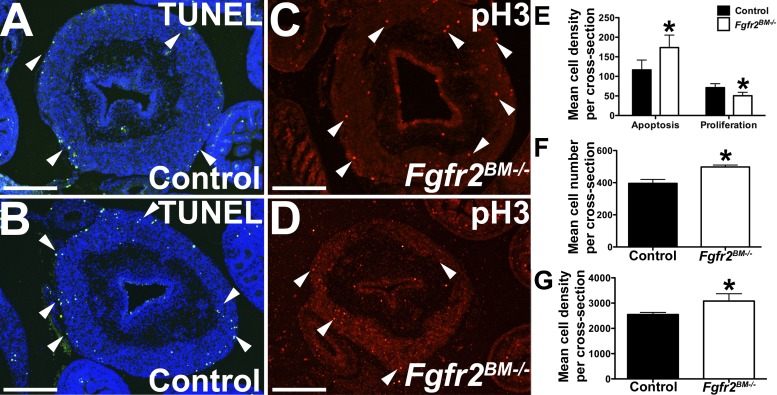
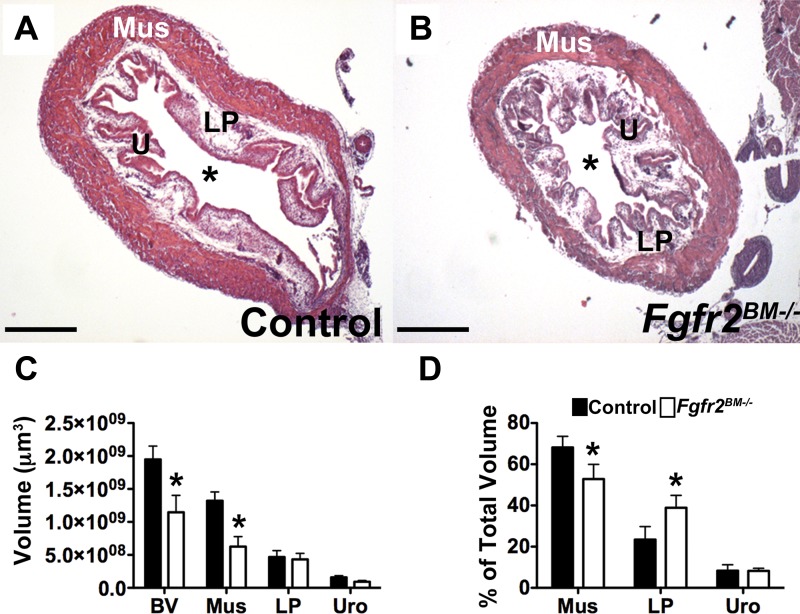
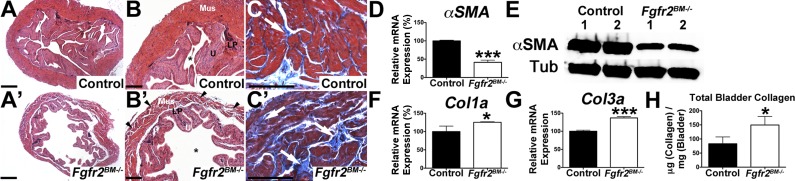
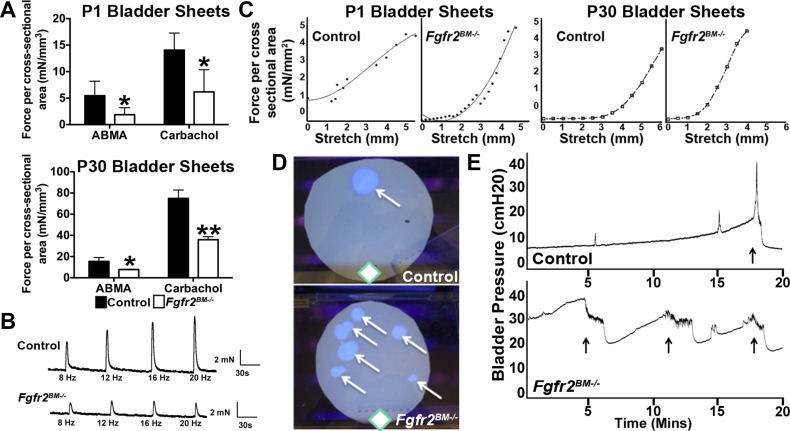
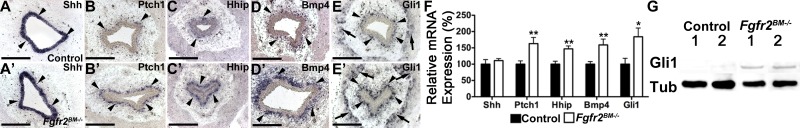
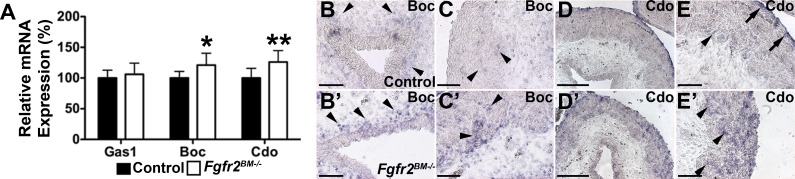
While urothelial signals, including sonic hedgehog (Shh), drive bladder mesenchyme differentiation, it is unclear which pathways within the mesenchyme are critical for its development. Studies have shown that fibroblast growth factor receptor (Fgfr)2 is necessary for kidney and ureter mesenchymal development. The objective of the present study was to determine the role of Fgfr2 in the bladder mesenchyme. We used Tbx18cre mice to delete Fgfr2 in the bladder mesenchyme (Fgfr2(BM-/-)). We performed three-dimensional reconstructions, quantitative real-time PCR, in situ hybridization, immunolabeling, ELISAs, immunoblot analysis, void stain on paper, ex vivo bladder sheet assays, and in vivo decerebrated cystometry. Compared with control bladders, embryonic day 16.5 (E16.5) Fgfr2(BM-/-) bladders had thin muscle layers with less α-smooth muscle actin and thickened lamina propria with increased collagen type Ia and IIIa that intruded into the muscle. The reciprocal changes in mutant layer thicknesses appeared partly due to a cell fate switch. From postnatal days 1 to 30, Fgfr2(BM-/-) bladders demonstrated progressive muscle loss and increased collagen expression. Postnatal Fgfr2(BM-/-) bladder sheets exhibited decreased agonist-mediated contractility and increased passive stretch tension versus control bladder sheets. Cystometry revealed high baseline and threshold pressures and shortened intercontractile intervals in Fgfr2(BM-/-) versus control bladders. Mechanistically, whereas Shh expression appeared normal, mRNA and protein readouts of hedgehog activity were increased in E16.5 Fgfr2(BM-/-) versus control bladders. Moreover, E16.5 Fgfr2(BM-/-) bladders exhibited higher levels of Cdo and Boc, hedgehog coreceptors that enhance sensitivity to Shh, compared with control bladders. In conclusion, loss of Fgfr2 in the bladder mesenchyme leads to abnormal bladder morphology and decreased compliance and contractility.

Keywords: bladder development; bladder dysfunction; fibroblast growth factor receptor 2.


Figures

Fig. 1.
Fig. 1.
Tbx18cre drives efficient fibroblast growth factor receptor (Fgfr)2 deletion in the embryonic day (E)13.5 bladder mesenchyme (BM). A: hematoxylin and eosin (H&E) stain of a Tbx18cre:CAG red fluorescent protein (RFP) E13.5 bladder cross-section. B: fluorescent image from an adjacent section to that shown in A illustrating RFP-positive cre expression in the bladder mesenchyme but not in the urothelium (U). C and D: in situ hybridization for Fgfr2 showing expression in both bladder mesenchyme (arrowhead) and urothelial tissue layers (arrow) in a control bladder but an absence of Fgfr2 expression in the bladder mesenchyme in a Fgfr2BM−/− bladder. In A–D, the dotted line indicates the outer boundary of the developing bladder. UA, umbilical artery. *Bladder lumen. Scale bars = 150 μm. E: quantitative PCR confirmed the significant reduction in Fgfr2 mRNA expression in Fgfr2BM−/− whole bladders. F: Western blots demonstrating reduced Erk1/2 phosphorylation [phosphorylated (p)Erk1/2] with comparable total (t)Erk1/2 in E16.5 Fgfr2BM−/− bladders compared with age-matched control bladders. a/b Tubulin (Tub), α/β-tubulin (loading control). Values are mean ± SD. *P < 0.05.
Fig. 2.
Fig. 2.
Control and Fgfr2BM−/− bladders are comparable at E13.5. A and B: H&E-stained E13.5 sections of control (A) and Fgfr2BM−/− (B) bladders demonstrated similar histology. C and D: three-dimensional (3-D) reconstructions revealed similar lamina propria (LP) volume (red) and muscle (Mus) volume (brown) in E13.5 Fgfr2BM−/− (D) versus control (C) bladders. *Lumen. E: graph of 3D bladder reconstructions confirming comparable total bladder (BV), muscle, lamina propria, and urothelial (Uro) mean volumes in E13.5 controls and mutants. F: graph showing that when normalized to total bladder volumes, mean muscle, lamina propria, and urothelial volume percentages were comparable between Fgfr2BM−/− and age-matched control bladders. G: graph of 3-D bladder “dome” reconstructions confirming comparable bladder, lamina propria, and urothelial mean volumes in E13.5 controls and mutants. H: graph demonstrating that when normalized to bladder dome volume, muscle, lamina propria, and urothelial volume percentages were comparable between Fgfr2BM−/− and control bladders. I: graph of 3-D bladder neck reconstructions confirming comparable bladder, lamina propria, and urothelial mean volumes in E13.5 controls and mutants. J: graph showing that when normalized to bladder neck volume, muscle, lamina propria, and urothelial volume percentages were comparable between Fgfr2BM−/− and age-matched control bladders. Values are means ± SD. Scale bars = 150 μm in A and B.
Fig. 3.
Fig. 3.
E16.5 Fgfr2BM−/− bladders have reduced muscle and increased lamina propria. A and B: the H&E-stained E16.5 bladder section from an Fgfr2BM−/− embryo (B) appeared to have thinner muscle regions (arrowheads) and an expanded lamina propria compared with that from an age-matched control embryo (A). Scale bars = 300 μm. C and D: 3-D reconstructions revealed an expanded volume of lamina propria (red) and reduced volume of muscle (brown) in E16.5 Fgfr2BM−/− (D) versus control (C) bladders. *Lumen. E: graph of 3-D bladder reconstructions showing comparable total bladder, muscle, and urothelial mean volumes in E16.5 mutants and controls but a significant increase in lamina propria mean volume in Fgfr2BM−/− versus control bladders. F: graph showing that when normalized to total bladder volume, mean muscle volume percentage was reduced, lamina propria percentage was increased, and urothelial percentage was equivalent in E16.5 Fgfr2BM−/− versus control bladders. G: graph of 3-D bladder dome reconstructions showing comparable bladder, muscle, and urothelial mean volumes in E16.5 mutants and controls but a significant increase in lamina propria mean volume in Fgfr2BM−/− versus control bladders. H: graph showing that when normalized to bladder dome volume, mean muscle volume percentage was reduced, lamina propria percentage was increased and urothelial percentage was equivalent in E16.5 Fgfr2BM−/− versus control bladders. I: graph of 3-D bladder neck reconstructions showing comparable bladder, lamina propria, and urothelial mean volumes in E16.5 mutants and controls but a significant decrease in muscle mean volume in Fgfr2BM−/− versus control bladders. J: graph showing that when normalized to bladder neck volume, mean muscle volume percentage was reduced, lamina propria percentage was increased, and urothelial percentage was equivalent in E16.5 Fgfr2BM−/− versus control bladders. Values are means ± SD. *P < 0.05; **P < 0.01.
Fig. 4.
Fig. 4.
E16.5 Fgfr2BM−/− bladders have decreased smooth muscle and increased collagen levels. A and B: α-smooth muscle actin (α-SMA) immunostaining (red, arrows) revealed regions of thinner muscle in Fgfr2BM−/− (B, arrowheads) versus control (A) bladders. Blue shows 4′,6-diamidino-2-phenylindole (DAPI) nuclear staining. C: quantitative PCR showing significantly reduced α-SMA expression in E16.5 Fgfr2BM−/− versus control bladders. D: Western blots demonstrating reduced total α*SMA protein expression in E16.5 Fgfr2BM−/− compared with age-matched control bladders. α/β-Tubulin was used as a loading control. E and F: collagen type Ia (Col1a) immunohistochemistry revealed more intense staining in the lamina propria (below dotted lines) and regions of collagen infiltration in the smooth muscle layer (arrowheads) of E16.5 Fgfr2BM−/− (F) versus control (E) bladders. G: quantitative PCR showing significantly increased Col1a mRNA expression in E16.5 Fgfr2BM−/− versus control whole bladders. H and I: collagen type IIIa (Col3a) immunostaining showed brighter staining (below dotted lines) and collagen infiltration into the smooth muscle layer (arrowhead) of E16.5 Fgfr2BM−/− (I) versus control (H) bladders. J: quantitative PCR showing significantly increased Col3a mRNA expression in E16.5 Fgfr2BM−/− versus control bladders. K: graph showing increased collagen in whole E16.5 Fgfr2BM−/− bladder lysates compared with age-matched control bladder lysates. Scale bars = 300 μm in A, B, E, F, H, and I. Values are means ± SD in C, G, J, and K. *P < 0.05; **P < 0.01.
Fig. 5.
Fig. 5.
E16.5 Fgfr2BM−/− bladder muscle exhibits increased apoptosis and decreased cell proliferation. A and B: representative bladder cross-sections revealed more TUNEL-positive cells (green, arrowheads) in mutant (B) versus control (A) detrusor muscle layers, with a relative lack of staining in both mutant and control lamina propria and urothelium. C and D: representative bladder cross-sections showing decreased phospho-histone H3 positive proliferating cells (red, arrowhead) in muscle layers of E16.5 Fgfr2BM−/− (D) versus control (C) embryos. E: graph showing elevated apoptosis and decreased cell proliferation in Fgfr2BM−/− compared with age-matched control bladders. F and G: graphs demonstrating increased mean cell number per cross section and mean cell density within the lamina propria (in cells/mm2) of Fgfr2BM−/− compared with age-matched control bladders. Scale bars = 300 μm. Values are means ± SD. *P < 0.05.
Fig. 6.
Fig. 6.
P1 Fgfr2BM−/− bladders are smaller and have muscle and lamina propria mispatterning. A and B: H&E-stained sections revealed a decrease in bladder size and regions of thin muscle in P1 Fgfr2BM−/− (B) versus control (A) pups. Mus, detrusor muscle. *Lumen. C: graph of 3-D bladder reconstructions demonstrating a significant reduction in total bladder and muscle volumes in Fgfr2BM−/− compared with age-matched control bladders. D: graph showing that when normalized to total bladder volumes, mean muscle percentage was reduced, lamina propria percentage was increased and urothelial percentage was equivalent in P1 Fgfr2BM−/− versus age-matched control bladders. Scale bars = 500 μm. Values are means ± SD. *P < 0.05.
Fig. 7.
Fig. 7.
P1 Fgfr2BM−/− bladders have decreased smooth muscle and increased collagen. A and B: α*SMA immunostaining (red) in a P1 Fgfr2BM−/− bladder (B) appeared less compact than in a control bladder (A). Blue indicates DAPI nuclear staining. C: quantitative PCR illustrating reduced α-SMA mRNA expression in P1 Fgfr2BM−/− bladders than in control bladders. D: Western blots demonstrating reduced α-SMA protein in P1 Fgfr2BM−/− compared with age-matched control bladders. α/β-Tubulin was used as a loading control. E and F: Col1a labeling revealed regions of increased collagen deposition (arrowhead) in P1 Fgfr2BM−/− (F) versus control (E) bladder muscle layers. G: quantitative PCR showing increased Col1a mRNA expression in P1 Fgfr2BM−/− versus control bladders. H and I: Col3a immunostaining (arrowhead) appeared similar in P1 Fgfr2BM−/− (I) versus control (H) bladder smooth muscle layers. J: quantitative PCR showing a trend for increased Col3a mRNA expression in P1 Fgfr2BM−/− versus control bladders (P = 0.06). K: graph showing increased collagen in whole P1 Fgfr2BM−/− bladder lysates compared with age-matched control bladder lysates. In E, F, H, and I, the dotted line represents the boundary or lamina propria and smooth muscle layer. Scale bars = 300 μm in A, B, E, F, H, and I. Values are means ± SD in C, G, J, and K. *P < 0.05; **P < 0.01.
Fig. 8.
Fig. 8.
P30 Fgfr2BM−/− bladders have reduced muscle and increased collagen. A and A′: low-power H&E-stained images of P30 control and Fgfr2BM−/− bladders showing comparable overall sizes but decreased mutant bladder wall thickness versus controls. B and B′: higher-power analysis indicating a thinner and less compact muscle layer in P30 Fgfr2BM−/− (A′, arrowhead) compared with age-matched control (A) bladders. *Lumen. C and C′: trichrome staining showing increased collagen deposition (white arrows) in the detrusor layer of P1 Fgfr2BM−/− (B′) compared with age-matched control (B) bladders. D: quantitative PCR showing significantly reduced α-SMA mRNA expression in P30 Fgfr2BM−/− bladders than in control bladders. E: Western blots demonstrating reduced α-SMA protein in P30 Fgfr2BM−/− compared with age-matched control bladders. α/β- Tubulin was used as a loading control. F and G: quantitative PCR showing increased Col1a and Col3a mRNA expression in P30 Fgfr2BM−/− versus age-matched control bladders. H: graph showing increased collagen in whole P30 Fgfr2BM−/− bladder lysates compared with age-matched control bladder lysates. Scale bar = 700μm in A and A′, 500 μm in B and B′, and 300 μm in C and C′.Values are means ± SD. *P < 0.05; ***P < 0.001.
Fig. 9.
Fig. 9.
Fgfr2BM−/− mice have bladder and voiding dysfunction. A: ex vivo bladder sheets from P1 and P30 Fgfr2BM−/− mice exhibited attenuated contractile force generation when stimulated via α,β-methylene ATP (ABMA; purinurgic) or carbachol (muscarinic) agonists compared with age-matched control mice. *P < 0.05; **P < 0.01. B: representative electrical field stimulation profiles of P30 bladder sheets demonstrated an attenuated response to all frequencies in Fgfr2BM−/− compared with age-matched control bladders. C: passive tension profiles in response to stretch showed a leftward shift in Fgfr2BM−/− P1 and P30 compared with age-matched control bladders. D: representative void stain on paper assays from P30 control and Fgfr2BM−/− mice showing the frequency and location of voids (arrows) relative to the source of food and water (diamonds) in the cage. E: representative 20-min in vivo cystometry tracings showing higher baseline and threshold pressures and shortened intercontraction intervals in P30 Fgfr2BM−/− versus control mice (arrows show voiding responses).
Fig. 10.
Fig. 10.
P1 Fgfr2BM−/− mice have no urethral obstruction. A–X: H&E-stained serial sections from the most distal (A) to proximal portion (X) of the urethra in a P1 Fgfr2BM−/− male mouse showed an observable lumen (arrowhead) at all levels with no evidence of obstruction. Scale bars = 150 μm.
Fig. 11.
Fig. 11.
E16.5 Fgfr2BM−/− bladders exhibit augmented sonic hedgehog (Shh) signaling. A: in situ hybridization revealed comparable urothelial Shh mRNA expression (arrowheads) in E16.5 control (A) and Fgfr2BM−/− (A′) bladders. B–D: in situ hybridization revealed that patched homolog 1 (Ptch1), hedgehog-interacting protein (Hhip), and bone morphogenetic protein 4 (Bmp4) mRNA expressions (arrowheads) were more intense in the suburothelial lamina propria in E16.5 Fgfr2BM−/− bladders (B–E′) than in age-matched control bladders (B–D). E: Gli1 mRNA expression was more robust in both suburothelial (arrowheads) and muscle layers (arrows) in E16.5 Fgfr2BM−/− bladders (E′) than in control bladders (E). F: quantitative PCR confirmed no change in Shh mRNA but increased expression of hedgehog readouts (Ptch1, Hhip, Bmp4, and Gli1) in E16.5 Fgfr2BM−/− versus control bladders. *P < 0.05; **P < 0.01. G: Western blots showing increased Gli1 protein in E16.5 Fgfr2BM−/− compared with age-mated control bladders. α/β-Tubulin was used as a loading control. Values are means ± SD. Scale bars = 300 μm in A–E.
Fig. 12.
Fig. 12.
E16.5 Fgfr2BM−/− bladders have increased Boc and Cdo expression. A: quantitative PCR showing comparable growth arrest specific 1 (Gas1) mRNA expression but elevated Boc and Cdo mRNA expressions in E16.5 Fgfr2BM−/− compared with age-matched control bladders. B and C: in situ hybridization revealed more intense Boc expression in suburothelial (B, arrowheads) and muscle layers adjacent to the lamina propria (C, arrowheads) in E16.5 Fgfr2BM−/− bladders (B′ and C′) than in control bladders (B and C). D and E: in situ hybridization revealed that Cdo mRNA expression was confined to the muscle adjacent to the lamina propria (arrowhead) and outer serosal layer (arrows) of the E16.5 control bladder (D and E), whereas in the E16.5 mutant (D′ and E′), it was strongly expressed throughout the entire muscle layer (arrowheads) up to the serosal layer. Scale bars = 150 μm in B, B′, C, C′, E, and E′ and 300 μm in D and D′. Values are means ± SD. *P < 0.05; **P < 0.01.

Comment in

  • Findings of Research Misconduct.
    [No authors listed] [No authors listed] NIH Guide Grants Contracts (Bethesda). 2016 May 20:NOT-OD-16-090. NIH Guide Grants Contracts (Bethesda). 2016. PMID: 27220120 Free PMC article. No abstract available.
  • Findings of Research Misconduct.
    [No authors listed] [No authors listed] Fed Regist. 2016 May 11;81(91):29278. Fed Regist. 2016. PMID: 27737276 Free PMC article. No abstract available.

Similar articles

Cited by

References

    1. Allen BL, Song JY, Izzi L, Althaus IW, Kang JS, Charron F, Krauss RS, McMahon AP. Overlapping roles and collective requirement for the coreceptors GAS1, CDO, and BOC in SHH pathway function. Dev Cell 20: 775–787, 2011. - PMC - PubMed
    1. Arman E, Haffner-Krausz R, Chen Y, Heath JK, Lonai P. Targeted disruption of fibroblast growth factor (FGF) receptor 2 suggests a role for FGF signaling in pregastrulation mammalian development. Proc Natl Acad Sci USA 95: 5082–5087, 1998. - PMC - PubMed
    1. Avlan D, Gundogdu G, Taskinlar H, Delibas A, Nayci A. Relationships among vesicoureteric reflux, urinary tract infection and renal injury in children with non-neurogenic lower urinary tract dysfunction. J Pediatr Urol 7: 612–615, 2011. - PubMed
    1. Cao M, Liu B, Cunha G, Baskin L. Urothelium patterns bladder smooth muscle location. Pediatr Res 64: 352–357, 2008. - PMC - PubMed
    1. Cao M, Tasian G, Wang MH, Liu B, Cunha G, Baskin L. Urothelium-derived sonic hedgehog promotes mesenchymal proliferation and induces bladder smooth muscle differentiation. Differentiation 79: 244–250, 2010. - PMC - PubMed

Publication types

MeSH terms

LinkOut - more resources