. 2015 Apr 15;308(8):F938-49.
doi: 10.1152/ajprenal.00655.2014. Epub 2015 Feb 4.

Mechanism by which shock wave lithotripsy can promote formation of human calcium phosphate stones

Affiliations

Mechanism by which shock wave lithotripsy can promote formation of human calcium phosphate stones

Andrew P Evan et al. Am J Physiol Renal Physiol. .

Abstract

Human stone calcium phosphate (CaP) content correlates with higher urine CaP supersaturation (SS) and urine pH as well as with the number of shock wave lithotripsy (SWL) treatments. SWL does damage medullary collecting ducts and vasa recta, sites for urine pH regulation. We tested the hypothesis that SWL raises urine pH and therefore Cap SS, resulting in CaP nucleation and tubular plugging. The left kidney (T) of nine farm pigs was treated with SWL, and metabolic studies were performed using bilateral ureteral catheters for up to 70 days post-SWL. Some animals were given an NH4Cl load to sort out effects on urine pH of CD injury vs. increased HCO3 (-) delivery. Histopathological studies were performed at the end of the functional studies. The mean pH of the T kidneys exceeded that of the control (C) kidneys by 0.18 units in 14 experiments on 9 pigs. Increased HCO3 (-) delivery to CD is at least partly responsible for the pH difference because NH4Cl acidosis abolished it. The T kidneys excreted more Na, K, HCO3 (-), water, Ca, Mg, and Cl than C kidneys. A single nephron site that could produce losses of all of these is the thick ascending limb. Extensive injury was noted in medullary thick ascending limbs and collecting ducts. Linear bands showing nephron loss and fibrosis were found in the cortex and extended into the medulla. Thus SWL produces tubule cell injury easily observed histopathologically that leads to functional disturbances across a wide range of electrolyte metabolism including higher than control urine pH.

Keywords: histopathology; pH regulation; renal function; thick ascending limb.


Figures

Fig. 1.
Fig. 1.
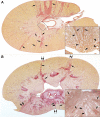
Low-magnification light micrographs of zone 3 of pig 910 (A) and zone 4 of pig 921 (B) seen in transverse sections stained with picro-sirus red. Prominent reddish-stained bands are noted extending from the renal capsule as far down as the inner medulla (arrows), which define regions of interstitial fibrosis. Occasionally, these bands are associated with dimpling at the renal capsule (B, double arrows). In B, extensive scarring is noted to an entire renal lobule, which is outlined by a series of double arrowheads. A papillum from each section (outlined by a rectangle) is enlarged and seen as an inset at the bottom right of A and B. Bands of interstitial fibrosis are easily seen in the outer and inner medulla (arrows), which are interdispersed with dilated tubular profiles of inner medullary collecting ducts (single arrowheads).
Fig. 2.
Fig. 2.
Segmental nephron injury in the cortex of treated kidneys. A: sharp transition from regions of interstitial fibrosis (arrows) to normal-appearing nephron segments (arrowheads) in a picro-sirus red-stained section. B: within sites of interstitial fibrosis, glomeruli appear normal (arrowheads) to sclerotic (arrows), while many nearby tubular segments appear small and atrophic (double arrowheads). Cortical collecting ducts (CCD) and thick ascending limbs (cTAL) adjacent to regions of interstitial fibrosis appear dilated with normal-appearing cells (C and D). Proximal tubules adjacent to fibrotic bands varied from normal (F, double arrowheads) to thickening of basement membranes with reduced overall diameter (C, arrowheads), smaller epithelial cells (E, arrows), and even complete obliteration (C and E, asterisk).
Fig. 3.
Fig. 3.
Pattern of injury in the outer medulla of treated kidneys. The outer medulla of injured papillae were diffusely abnormal, ranging in severity from almost complete atrophy of all tubular segments (A, arrowheads) except for a few dilated medullary collecting ducts (arrows) to modest interstitial fibrosis associated with almost all medullary thick ascending limbs (mTAL) and outer medullary collecting ducts (OMCD; AE) showing wavy irregularity and dilation. Lining cell epithelium of some OMCD was focally heaped up in a polypoid configuration (E, arrows). The S3 segments of proximal tubules (PT; F, arrows) adjacent to bands showed the variable loss of cell height and basement membrane thickening observed in cortical PT.
Fig. 4.
Fig. 4.
Proliferating cells identified with Ki-67 antibody. Tissue sections of the outer medulla from the untreated (A) and treated (B) kidney from pig 983 showed Ki-67-positive nuclei only in the mTAL (B, arrowheads) and OMCD (B, arrows) of the treated kidney.
Fig. 5.
Fig. 5.
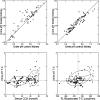
Effects of shock wave lithotripsy (SWL) on urine pH. Urine pH of SWL-treated (T) kidneys (top left, y-axis) exceeded that of control (C) kidneys (x-axis) as shown by displacement of points above the diagonal line of identity. After induction of NH4Cl acidosis (top right), the pH difference was abolished and points range above and below the line of identity. The T − C urine pH difference (bottom left, y-axis) varied significantly with serum HCO3 (x-axis) during NH4Cl acidosis (black circles) but not under basal conditions (gray circles) even when points were fitted with a quadratic smoother (curving regression line). The T − C urine pH difference varied with the T − C bicarbonate-filtered load difference (bottom right, x-axis) in the basal (gray circles) but not NH4Cl acidosis periods (black circles). However, the basal regression was not statistically significant. For visual clarity, 95% nonparametric ellipses of containment enclose the points of the bottom 2 panels.
Fig. 6.
Fig. 6.
T − C differences in pH, HCO3, water, Na, Cl, and K excretion during individual experiments. In each panel, the experiments of Table 1 are shown along the x-axis. Gray bars represent the T − C mean basal difference for that experiment ± SE; black bars show NH4Cl loading periods. The dashed horizontal lines represent a 0 difference.
Fig. 7.
Fig. 7.
Correlations between T − C differences in water, Cl, Ca, and Na excretions. Gray circles are basal periods, black circles are NH4Cl acidosis periods. Non parametric confidence ellipses are calculated to include 68% of points. All regressions are highly significant (r > 0.9, P < 0.001).

Similar articles

Cited by

References

    1. Bhojani N, Paonessa JE, Worcester EM, van AP, Coe FL, Lingeman JE. The majority of calcium phosphate stone formers without systemic disease have nephrocalcinosis. J Urol 189: e924–e925, 2013. - PMC - PubMed
    1. Capasso G, Unwin R, Rizzo M, Pica A, Giebisch G. Bicarbonate transport along the loop of Henle: molecular mechanisms and regulation. J Nephrol 15, Suppl 5: S88–S96, 2002. - PubMed
    1. Clark DL, Connors BA, Evan AP, Willis LR, Handa RK, Gao S. Localization of renal oxidative stress and inflammatory response after lithotripsy. BJU Int 103: 1562–1568, 2009. - PMC - PubMed
    1. Daudon M, Donsimoni RHC, Fellahi S, Le Moel G, Paris M, Troupel S, Lacour B. Sex and age-related composition of 10617 calculi analyzed by infrared spectropscopy. Urol Res 23: 326, 1995. - PubMed
    1. Drach GW, Dretler S, Fair W, Finlayson B, Gillenwater J, Griffith D, Lingeman J, Newman D. Report of the United States cooperative study of extracorporeal shock wave lithotripsy. J Urol 135: 1127–1133, 1986. - PubMed

Publication types

MeSH terms