. 2015 Jun:93:15-27.
doi: 10.1016/j.neuropharm.2015.01.017. Epub 2015 Feb 3.

Inhibition of the prostaglandin EP2 receptor is neuroprotective and accelerates functional recovery in a rat model of organophosphorus induced status epilepticus

Affiliations

Inhibition of the prostaglandin EP2 receptor is neuroprotective and accelerates functional recovery in a rat model of organophosphorus induced status epilepticus

Asheebo Rojas et al. Neuropharmacology. 2015 Jun.

Abstract

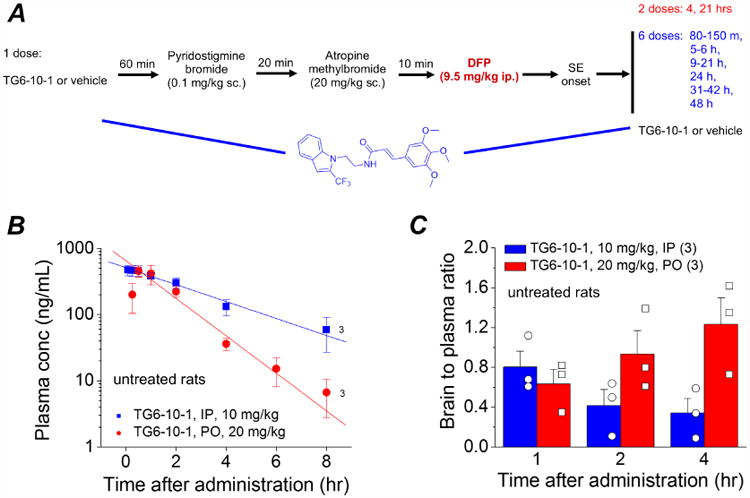
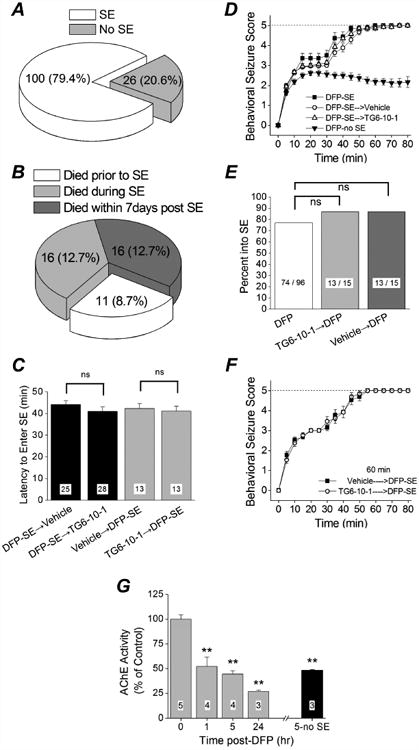
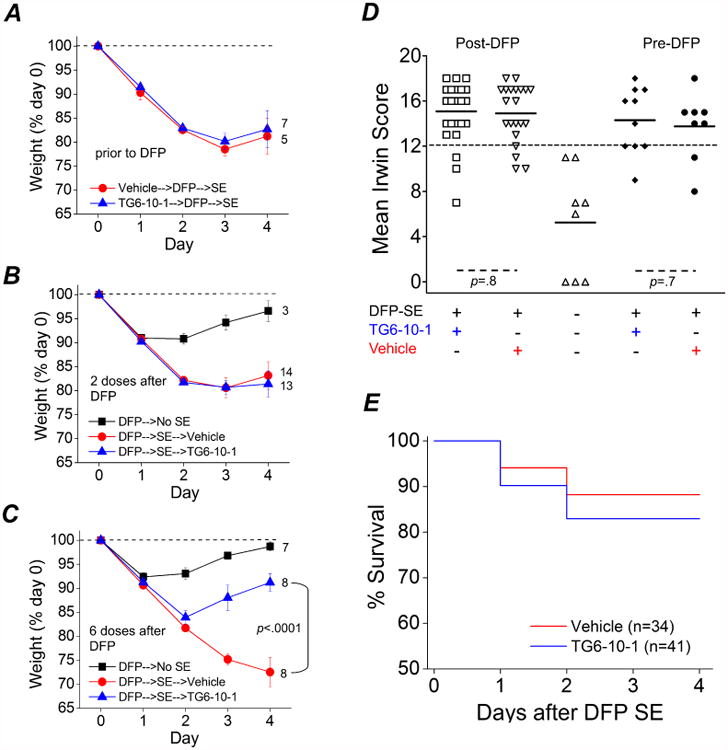
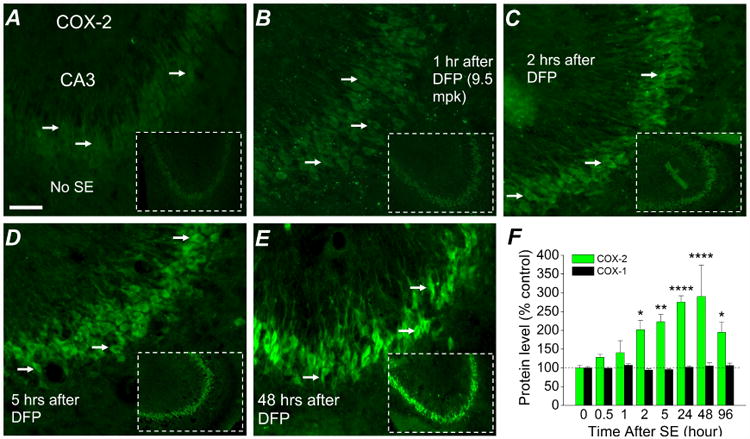
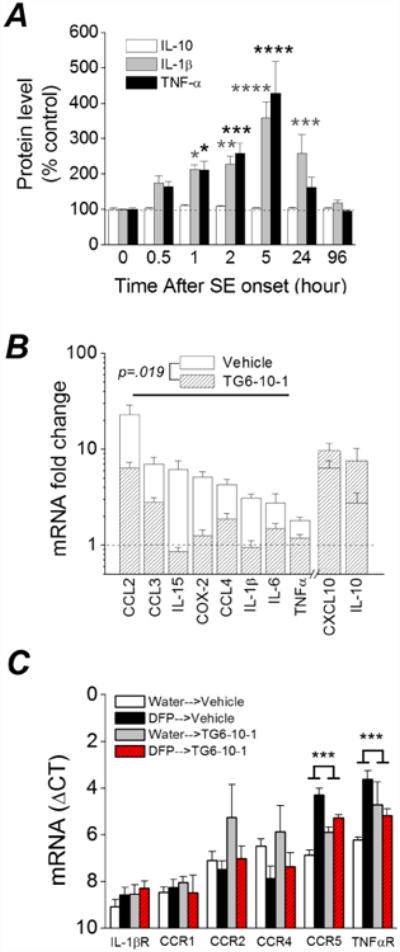
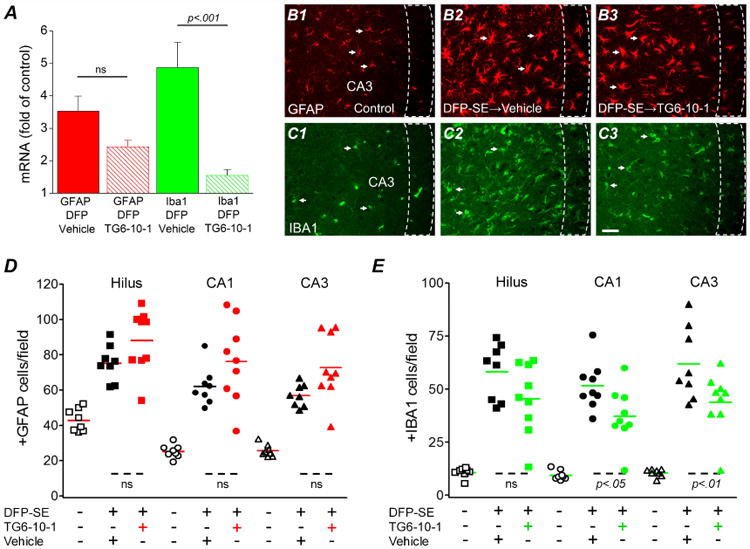
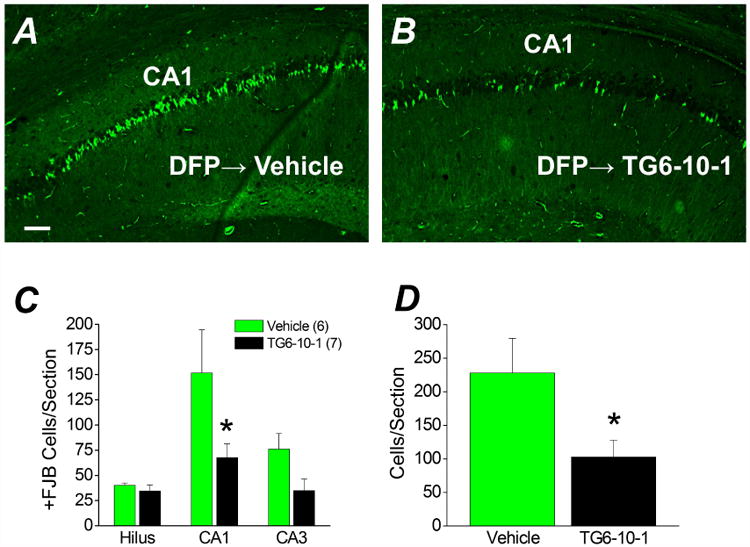
Exposure to high levels of organophosphorus compounds (OP) can induce status epilepticus (SE) in humans and rodents via acute cholinergic toxicity, leading to neurodegeneration and brain inflammation. Currently there is no treatment to combat the neuropathologies associated with OP exposure. We recently demonstrated that inhibition of the EP2 receptor for PGE2 reduces neuronal injury in mice following pilocarpine-induced SE. Here, we investigated the therapeutic effects of an EP2 inhibitor (TG6-10-1) in a rat model of SE using diisopropyl fluorophosphate (DFP). We tested the hypothesis that EP2 receptor inhibition initiated well after the onset of DFP-induced SE reduces the associated neuropathologies. Adult male Sprague-Dawley rats were injected with pyridostigmine bromide (0.1 mg/kg, sc) and atropine methylbromide (20 mg/kg, sc) followed by DFP (9.5 mg/kg, ip) to induce SE. DFP administration resulted in prolonged upregulation of COX-2. The rats were administered TG6-10-1 or vehicle (ip) at various time points relative to DFP exposure. Treatment with TG6-10-1 or vehicle did not alter the observed behavioral seizures, however six doses of TG6-10-1 starting 80-150 min after the onset of DFP-induced SE significantly reduced neurodegeneration in the hippocampus, blunted the inflammatory cytokine burst, reduced microglial activation and decreased weight loss in the days after status epilepticus. By contrast, astrogliosis was unaffected by EP2 inhibition 4 d after DFP. Transient treatments with the EP2 antagonist 1 h before DFP, or beginning 4 h after DFP, were ineffective. Delayed mortality, which was low (10%) after DFP, was unaffected by TG6-10-1. Thus, selective inhibition of the EP2 receptor within a time window that coincides with the induction of cyclooxygenase-2 by DFP is neuroprotective and accelerates functional recovery of rats.

Keywords: COX-2; DFP; EP2; Hippocampus; Inflammation; Neurodegeneration; Organophosphorus; PGE2; Status epilepticus.


Figures

Figure 1
Figure 1
A, Experimental paradigm of chemical administration in a rat model of DFP-induced status epilepticus. For the pre-treatment experiment, rats were injected with 1 dose of the EP2 antagonist TG6-10-1 (5 mg/kg, ip) or vehicle one hour prior to DFP. For post-treatment following DFP, rats were injected with multiple doses (red = 2 doses and blue = 6 doses) of TG6-10-1 or vehicle beginning 80-150 minutes from the onset of SE. B, plasma concentration of untreated rats that received TG6-10-1 (n = 3 rats) ip (10 mg/kg) or po (20 mg/kg). The plasma levels of TG6-10-1 decreased over time. However, the brain to plasma ratio (C) increased in rats administered TG6-10-1 orally.
Figure 2
Figure 2. DFP-induced status epilepticus
A, of 126 rats administered DFP, 100 entered status epilepticus. B, percent mortality before, during and after status epilepticus. Mortality prior to the onset of status epilepticus is attributed to acute respiratory arrest caused by DFP. C, latency to the onset of status epilepticus following a single intraperitoneal injection of DFP in different groups of rats. (ns = p > .05, one-way ANOVA with posthoc Bonferroni). The number inside the bar represent the number of rats from each group. D, the mean behavioral seizure scores of rats that received a single injection of DFP only (n = 14 rats), DFP followed by 6 doses of vehicle (n = 25 rats) and DFP followed by 6 doses of TG6-10-1 (n = 28 rats) are plotted as a function of time. Also shown is the behavioral seizure activity of rats that did not enter status epilepticus (n = 16 rats). The dashed line indicates the behavioral seizure activity score at the onset of status epilepticus. E, percent of rats entering status epilepticus following a single intraperitoneal injection of DFP was not reduced by a prior injection of TG6-10-1 (p = 0.52, Fisher's exact test). F, the mean behavioral score of rats that received a single injection of TG6-10-1 (n = 13 rats) or vehicle (n = 13 rats) followed by a single injection of DFP is plotted as a function of time. The dashed line indicates the behavioral seizure activity score at the onset of status epilepticus. G, inhibition of acetylcholinesterase in rat forebrain at the given times after DFP exposure. ** = p < .01, one-way ANOVA with posthoc Dunnett's. The number inside the bar represent the number of rats in each group.
Figure 3
Figure 3. Therapeutic window of TG6-10-1 after DFP-induced status epilepticus
A, a single dose of TG6-10-1 (5 mg/kg, ip) (n = 7 rats) or vehicle (n = 5 rats) administered prior to DFP-induced status epilepticus failed to influence weight regain over the subsequent 4 d. B, two doses of TG6-10-1 (n = 13 rats) or vehicle (n = 14 rats) administered 4 h and 21 h following onset of DFP-induced status epilepticus also failed to elicit weight regain by day four. Rats that were administered DFP, but did not enter status epilepticus (n = 3 rats) returned to their initial weight just prior to DFP exposure by day four. C, six injections of TG6-10-1 (n = 8 rats) beginning 80-150 min after SE onset significantly accelerated weight regain compared to vehicle (n = 8 rats) administration (p < .0001 by one-way ANOVA with posthoc Bonferroni). Rats administered DFP that did not enter status epilepticus (n = 7) returned to the initial weight just prior to DFP exposure by day four. D, rats injected with 2 or 6 doses of TG6-10-1 or vehicle following DFP were combined and labeled “Post-DFP”. Rats that were injected with a single dose of TG6-10-1 or vehicle 1 hour prior to DFP are labeled “Pre-DFP”. There was no difference in the mean Irwin score of rats administered TG6-10-1 (n = 25) following DFP (open squares) compared to rats administered vehicle (down facing open triangle) (n = 21) (p = .8, t test). Similarly, no difference was detected in the mean Irwin score of rats injected with a single dose of TG6-10-1 (closed diamonds) (n = 10) compared to rats injected with vehicle prior to DFP (closed circles) (n = 8) (p = .7, t test). The up facing open triangles are rats that did not enter status epilepticus (n = 8 rats) following DFP administration. The short horizontal bold lines represent the average of the individual animals within the group. The long horizontal dashed line represents the cutoff for determining whether an animal was healthy or impaired. The modified Irwin test score for all rats was 0 prior to drug administration (not shown). E, survival rates of rats that received TG6-10-1 (n = 41 rats) or vehicle (n = 34 rats) up to day 4 after DFP-induced status epilepticus. No difference was detected in the survival rate for rats administered TG6-10-1 (34 of 41 rats survived) compared to vehicle (30 of 34 rats survived) on days 1-4 after DFP-induced status epilepticus (p = .7, Fisher's exact test).
Figure 4
Figure 4. COX-2 is induced in principal neurons following DFP exposure
Fluorescent images taken from the CA3 region in the hippocampus (200× magnification) reveals basal expression of neuronal COX-2 in rats that did not experience status epilepticus (A); COX-2 elevation begins 1 h (B) and is prominent by 2 h after DFP-exposure (C). Neuronal COX-2 in the CA3 region is greatly induced 5 hours after DFP exposure (D) and appears to reach a peak 48 hours after DFP exposure (E), but declines back towards the basal level 96 hours after DFP induced status epilepticus (not shown). The images shown were representative of 5 sections each from 3 rats. F, changes in COX-1 and COX-2 protein in the brains of rats following DFP exposure at various times measured by ELISA. (n = 3-5 rats for each time point; * p < .05, ** p < .01, **** p < .0001, two-way ANOVA with Dunnett's post hoc test compared to time 0). Scale bar, 30 μm.
Figure 5
Figure 5. Induction of inflammatory cytokines and receptors 4 days after DFP induced status epilepticus in rats is attenuated by TG6-10-1
A, changes in IL-1β, TNFα and IL-10 protein in the forebrain at various times after DFP exposure measured by ELISA. (* p < .05, ** p < .01, *** p < .001, **** p < .0001, two-way ANOVA with Dunnett's post hoc test compared to time 0; n = 3-5 rats at each time point). B, change in abundance of 10 inflammatory mediator mRNAs from the forebrain of rats 4 d after injection with water or DFP to induce status epilepticus. Post-DFP treatment was 6 doses of TG6-10-1 (n = 8 rats) or vehicle (n = 9 rats). Following DFP induced status epilepticus, the mRNA fold change for 8 mediators as a group was significantly reduced by TG6-10-1 compared to vehicle (p = .019, paired t test). C, qRT-PCR was also performed to assess the abundance of 6 inflammatory cytokine and interleukin receptors (Table 2) (n = 8 rats per treatment group). The mRNA fold change for 2 of the receptors (TNFαR and CCR5) was significantly reduced by TG6-10-1 compared to vehicle (p < .001, one-way ANOVA with posthoc Bonferroni).
Figure 6
Figure 6. DFP induced microgliosis is reduced by TG6-10-1
A, induction of GFAP and Iba1 mRNA in the forebrain four days following DFP status epilepticus in vehicle treated (n = 7 rats) and TG6-10-1 treated rats (n = 7 rats) (one-way ANOVA with posthoc Bonferroni). Representative fluorescence images (200× total magnification) showing positive GFAP immunostaining (red) (B1) as an astrocyte marker and Iba1 immunostaining (green) (C1) as a microglial marker in the hippocampal CA3 region. Four days after DFP-induced status epilepticus, astrogliosis and microgliosis were obvious in the sections obtained from rats as defined by the increased number of positively labeled cells in rats treated with 6 injections of TG6-10-1 (B3, C3) compared to sections taken from rats injected with 6 doses of vehicle (B2, C2). The arrows indicate typical astrocytes and microglia in each group. Scale bar, 20 μm. The dash boxes outline the CA3 pyramidal cell layer. Quantification of astrogliosis (D) and microgliosis (E) defined by the number of positive GFAP and Iba1 cells counted in three hippocampal areas (i.e. hilus, CA1 and CA3). The average number of astrocytes and microglia from rats that endured DFP-induced status epilepticus followed by vehicle treatment (6 injections) (n = 8 rats) or TG6-10-1 (n = 9 rats) treatment (6 injections) was compared by one-way ANOVA with posthoc Bonferroni. Each symbol represents data from an individual rat. The short horizontal bold lines (colored) represent the average of the individual animals within the group. The short horizontal dashed lines at the bottom show the groups that are compared.
Figure 7
Figure 7. Neuroprotection by TG6-10-1 following DFP-induced status epilepticus
Representative images of FluoroJade B staining in hippocampal sections (8 μm) in the CA1 region for rats treated with 6 doses of vehicle (n = 6 rats) (A) four days after DFP-induced status epilepticus and rats injected with 6 doses of TG6-10-1 (n = 7 rats) (B). Images were taken at a total magnification of 100×. The images are representative of 8 sections per rat. Scale bar, 100 μm. C, the average number of injured neurons per section in three hippocampal regions of rats treated with 6 doses of vehicle (n = 6 rats) and rats injected with 6 doses of TG6-10-1 (n = 7 rats) four days after DFP-induced status epilepticus. (* p < .05 in CA1, one-way ANOVA with posthoc Bonferroni). D, the average number of injured pyramidal neurons from CA1 and CA3 combined per section. (* p < .05, t test). +FJB, positive FluoroJade B.

Similar articles

Cited by

References

    1. Andreasson K. Emerging roles of PGE2 receptors in models of neurological disease. Prostaglandins & other lipid mediators. 2010;91:104–12. - PMC - PubMed
    1. Angoa-Perez M, Kreipke CW, Thomas DM, Van Shura KE, Lyman M, McDonough JH, Kuhn DM. Soman increases neuronal COX-2 levels: possible link between seizures and protracted neuronal damage. Neurotoxicology. 2010;31:738–46. - PMC - PubMed
    1. Bilak M, Wu L, Wang Q, Haughey N, Conant K, St Hillaire C, Andreasson K. PGE2 receptors rescue motor neurons in a model of amyotrophic lateral sclerosis. Annals of neurology. 2004;56:240–8. - PubMed
    1. Borges K, Gearing M, McDermott DL, Smith AB, Almonte AG, Wainer BH, Dingledine R. Neuronal and glial pathological changes during epileptogenesis in the mouse pilocarpine model. Experimental neurology. 2003;182:21–34. - PubMed
    1. Chapman S, Kadar T, Gilat E. Seizure duration following sarin exposure affects neuro-inflammatory markers in the rat brain. Neurotoxicology. 2006;27:277–283. - PubMed

Publication types

MeSH terms