

Myocardial T2 mapping reveals age- and sex-related differences in volunteers
- PMID: 25656484
- PMCID: PMC4318191
- DOI: 10.1186/s12968-015-0118-0
Myocardial T2 mapping reveals age- and sex-related differences in volunteers
Abstract
Background: T2 mapping indicates to be a sensitive method for detection of tissue oedema hidden beyond the detection limits of T2-weighted Cardiovascular Magnetic Resonance (CMR). However, due to variability of baseline T2 values in volunteers, reference values need to be defined. Therefore, the aim of the study was to investigate the effects of age and sex on quantitative T2 mapping with a turbo gradient-spin-echo (GRASE) sequence at 1.5 T. For that reason, we studied sensitivity issues as well as technical and biological effects on GRASE-derived myocardial T2 maps. Furthermore, intra- and interobserver variability were calculated using data from a large volunteer group.
Methods: GRASE-derived multiecho images were analysed using dedicated software. After sequence optimization, validation and sensitivity measurements were performed in muscle phantoms ex vivo and in vivo. The optimized parameters were used to analyse CMR images of 74 volunteers of mixed sex and a wide range of age with typical prevalence of hypertension and diabetes. Myocardial T2 values were analysed globally and according to the 17 segment model. Strain-encoded (SENC) imaging was additionally performed to investigate possible effects of myocardial strain on global or segmental T2 values.
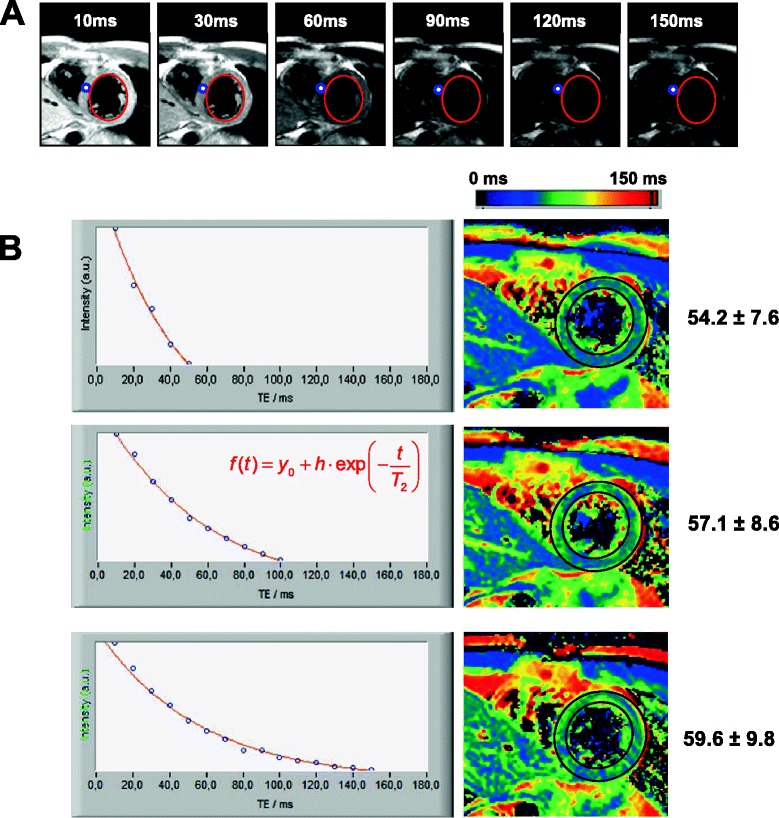
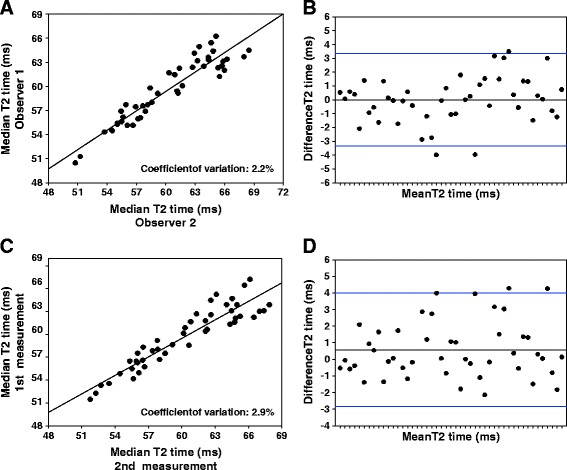
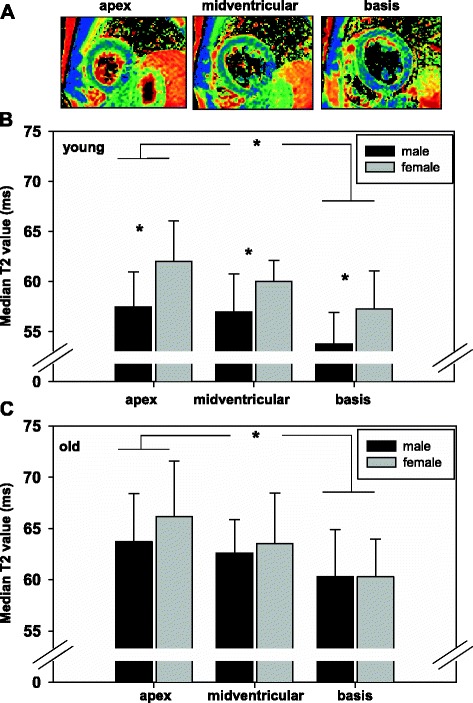
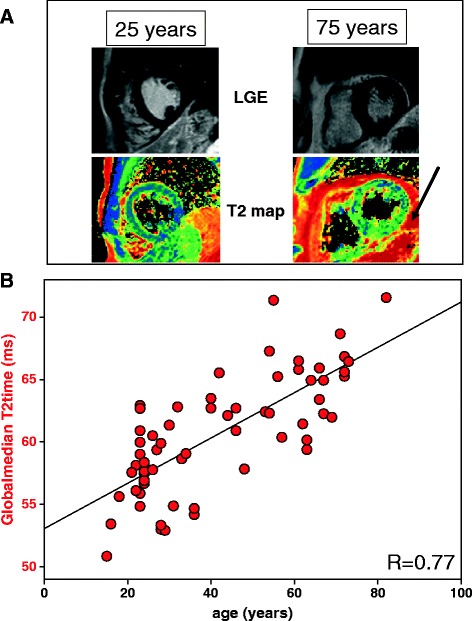
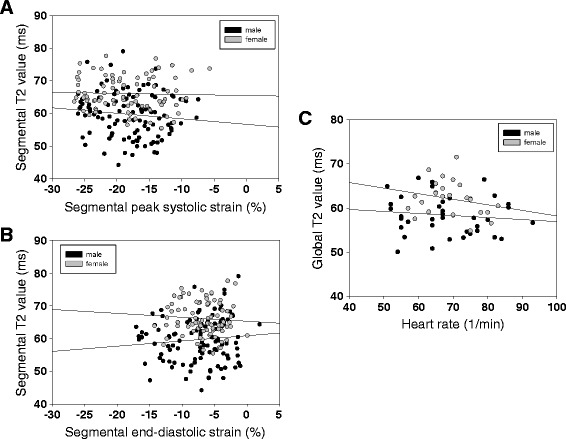
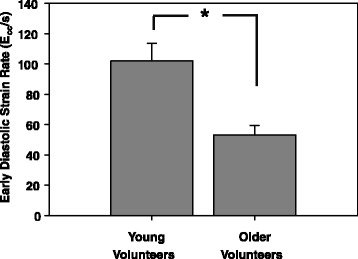
Results: Ex vivo studies in muscle phantoms showed, that GRASE-derived T2 values were comparable to those acquired by a standard multiecho spinecho sequence but faster by a factor of 6. Besides that, T2 values reflected tissue water content. The in vivo measurements in volunteers revealed intra- and interobserver correlations with R2=0.91 and R2=0.94 as well as a coefficients of variation of 2.4% and 2.2%, respectively. While global T2 time significantly decreased towards the heart basis, female volunteers had significant higher T2 time irrespective of myocardial region. We found no correlation of segmental T2 values with maximal systolic, diastolic strain or heart rate. Interestingly, volunteers´ age was significantly correlated to T2 time while that was not the case for other coincident cardiovascular risk factors.
Conclusion: GRASE-derived T2 maps are highly reproducible. However, female sex and aging with typical prevalence of hypertension and diabetes were accompanied by increased myocardial T2 values. Thus, sex and age must be considered as influence factors when using GRASE in a diagnostic manner.
Figures
Similar articles
-
Fast T2 gradient-spin-echo (T2-GraSE) mapping for myocardial edema quantification: first in vivo validation in a porcine model of ischemia/reperfusion.J Cardiovasc Magn Reson. 2015 Nov 4;17:92. doi: 10.1186/s12968-015-0199-9. J Cardiovasc Magn Reson. 2015. PMID: 26538198 Free PMC article.
-
Gradient Spin Echo (GraSE) imaging for fast myocardial T2 mapping.J Cardiovasc Magn Reson. 2015 Feb 12;17(1):12. doi: 10.1186/s12968-015-0127-z. J Cardiovasc Magn Reson. 2015. PMID: 25885268 Free PMC article.
-
Reproducibility of three different cardiac T2 -mapping sequences at 1.5T.J Magn Reson Imaging. 2016 Nov;44(5):1168-1178. doi: 10.1002/jmri.25258. Epub 2016 Apr 4. J Magn Reson Imaging. 2016. PMID: 27043352
-
Cardiac T2-mapping using a fast gradient echo spin echo sequence - first in vitro and in vivo experience.J Cardiovasc Magn Reson. 2015 Aug 1;17(1):67. doi: 10.1186/s12968-015-0177-2. J Cardiovasc Magn Reson. 2015. PMID: 26231927 Free PMC article.
-
A systematic evaluation of three different cardiac T2-mapping sequences at 1.5 and 3T in healthy volunteers.Eur J Radiol. 2015 Nov;84(11):2161-70. doi: 10.1016/j.ejrad.2015.08.002. Epub 2015 Aug 5. Eur J Radiol. 2015. PMID: 26276731
Cited by
-
Multiparametric cardiac magnetic resonance imaging in pediatric and adolescent patients with acute myocarditis.Pediatr Radiol. 2021 Dec;51(13):2470-2480. doi: 10.1007/s00247-021-05169-7. Epub 2021 Aug 25. Pediatr Radiol. 2021. PMID: 34435226 Free PMC article.
-
Advanced Myocardial MRI Tissue Characterization Combining Contrast Agent-Free T1-Rho Mapping With Fully Automated Analysis.J Magn Reson Imaging. 2025 Mar;61(3):1353-1365. doi: 10.1002/jmri.29502. Epub 2024 Jul 1. J Magn Reson Imaging. 2025. PMID: 38949101 Free PMC article.
-
A 3-slice cardiac quantitative native and post-contrast T1 and T2 MRI protocol requiring only four BHs using a 72-channel receive array coil.Front Cardiovasc Med. 2023 Nov 27;10:1285206. doi: 10.3389/fcvm.2023.1285206. eCollection 2023. Front Cardiovasc Med. 2023. PMID: 38089763 Free PMC article.
-
Strain-encoded magnetic resonance: a method for the assessment of myocardial deformation.ESC Heart Fail. 2019 Aug;6(4):584-602. doi: 10.1002/ehf2.12442. Epub 2019 Apr 25. ESC Heart Fail. 2019. PMID: 31021534 Free PMC article.
-
T1 and T2 mapping in the identification of acute myocardial injury in patients with NSTEMI.Radiol Med. 2018 Dec;123(12):926-934. doi: 10.1007/s11547-018-0931-2. Epub 2018 Aug 21. Radiol Med. 2018. PMID: 30132183
References
-
- Abdel-Aty H, Zagrosek A, Schulz-Menger J, Taylor AJ, Messroghli D, Kumar A, et al. Delayed enhancement and T2-weighted cardiovascular magnetic resonance imaging differentiate acute from chronic myocardial infarction. Circulation. 2004;109:2411–6. doi: 10.1161/01.CIR.0000127428.10985.C6. - DOI - PubMed
MeSH terms
LinkOut - more resources
Full Text Sources
Other Literature Sources
