

Predictive accuracy of novel risk factors and markers: A simulation study of the sensitivity of different performance measures for the Cox proportional hazards regression model
- PMID: 25656552
- PMCID: PMC5499735
- DOI: 10.1177/0962280214567141
Predictive accuracy of novel risk factors and markers: A simulation study of the sensitivity of different performance measures for the Cox proportional hazards regression model
Abstract
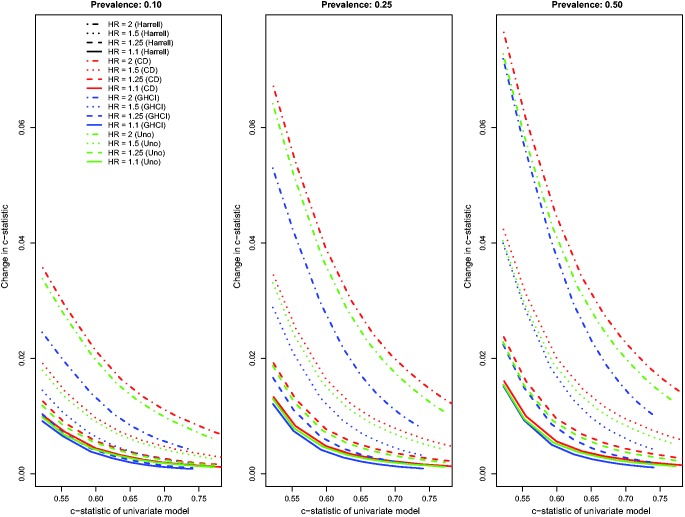
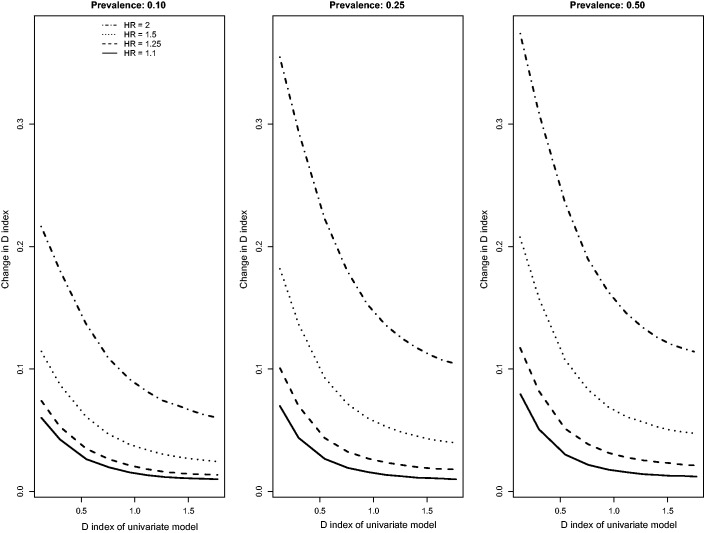
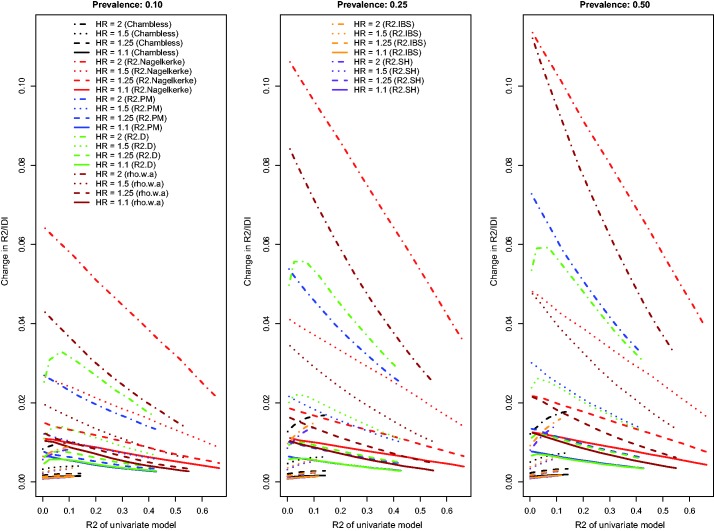
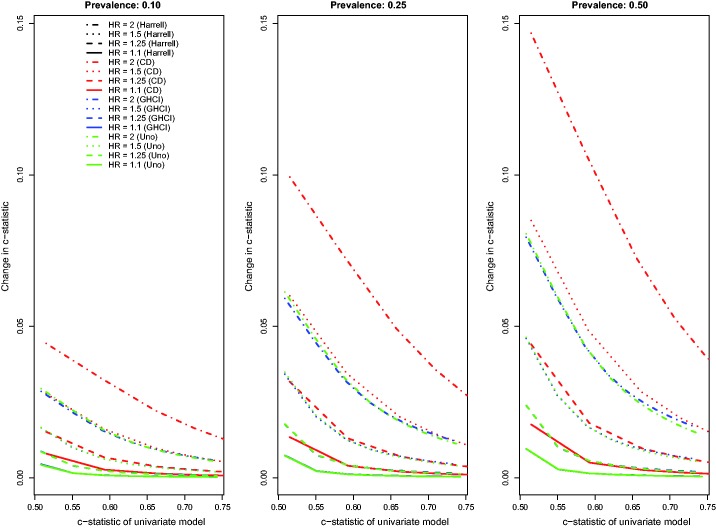
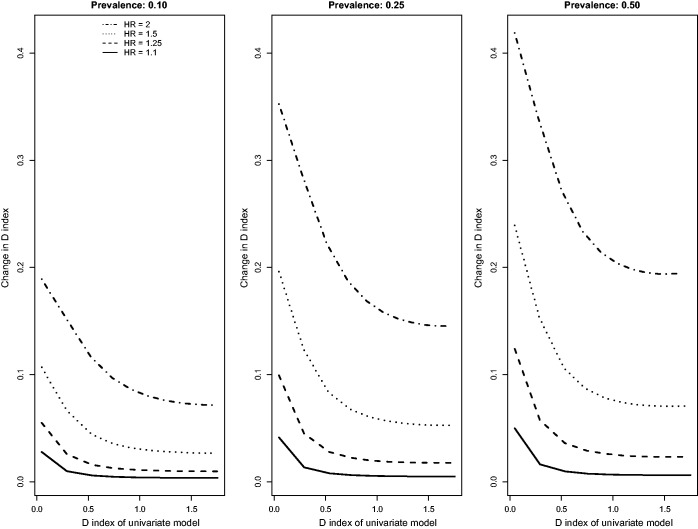
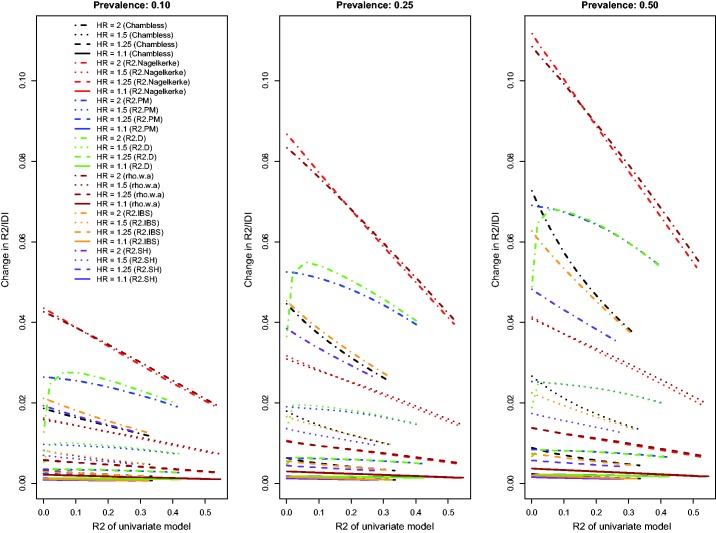
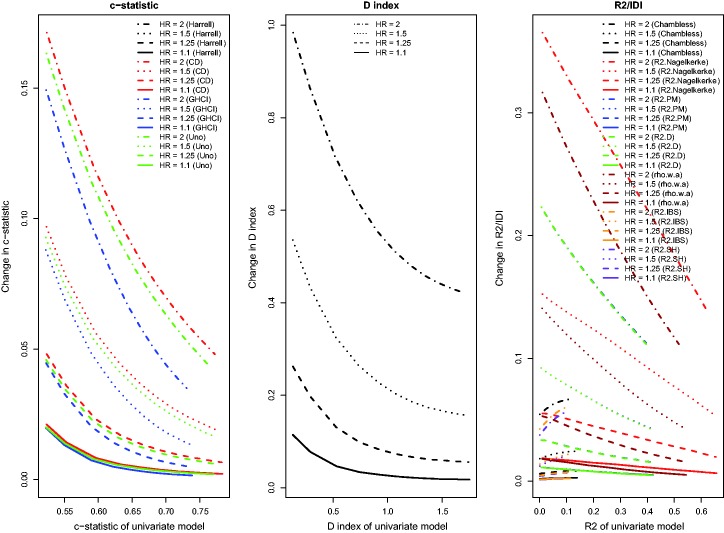
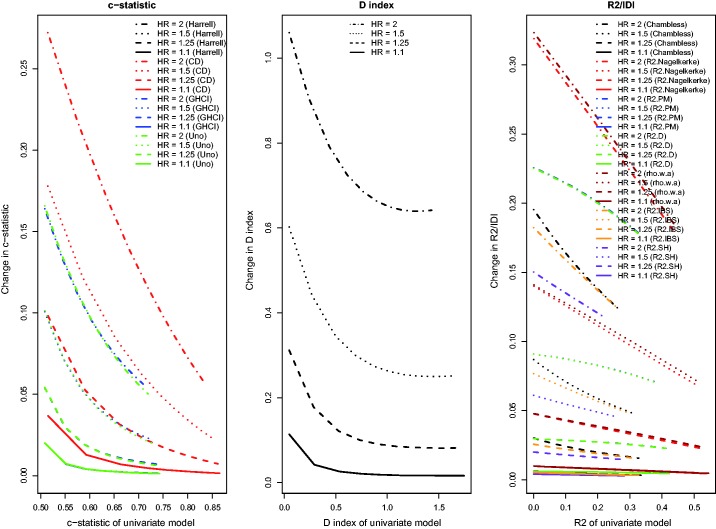
Predicting outcomes that occur over time is important in clinical, population health, and health services research. We compared changes in different measures of performance when a novel risk factor or marker was added to an existing Cox proportional hazards regression model. We performed Monte Carlo simulations for common measures of performance: concordance indices ( c, including various extensions to survival outcomes), Royston's D index, R2-type measures, and Chambless' adaptation of the integrated discrimination improvement to survival outcomes. We found that the increase in performance due to the inclusion of a risk factor tended to decrease as the performance of the reference model increased. Moreover, the increase in performance increased as the hazard ratio or the prevalence of a binary risk factor increased. Finally, for the concordance indices and R2-type measures, the absolute increase in predictive accuracy due to the inclusion of a risk factor was greater when the observed event rate was higher (low censoring). Amongst the different concordance indices, Chambless and Diao's c-statistic exhibited the greatest increase in predictive accuracy when a novel risk factor was added to an existing model. Amongst the different R2-type measures, O'Quigley et al.'s modification of Nagelkerke's R2 index and Kent and O'Quigley's [Formula: see text] displayed the greatest sensitivity to the addition of a novel risk factor or marker. These methods were then applied to a cohort of 8635 patients hospitalized with heart failure to examine the added benefit of a point-based scoring system for predicting mortality after initial adjustment with patient age alone.
Keywords: Cox proportional hazards model; Monte Carlo simulations; Survival analysis; discrimination; model performance; predictive accuracy; predictive models; risk factors.
Figures
References
-
- Austin PC, Manca A, Zwarenstein M, et al. A substantial and confusing variation exists in handling of baseline covariates in randomized controlled trials: a review of trials published in leading medical journals. J Clin Epidemiol 2010; 63: 142–153. - PubMed
-
- Chambless LE, Cummiskey CP, Cui G. Several methods to assess improvement in risk prediction models: extension to survival analysis. Stat Med 2011; 30: 22–38. - PubMed
-
- Choodari-Oskooei B, Royston P, Parmar MK. A simulation study of predictive ability measures in a survival model II: explained randomness and predictive accuracy. Stat Med 2012; 31: 2644–2659. - PubMed
-
- Choodari-Oskooei B, Royston P, Parmar MK. A simulation study of predictive ability measures in a survival model I: explained variation measures. Stat Med 2012; 31: 2627–2643. - PubMed
MeSH terms
Substances
LinkOut - more resources
Full Text Sources
Other Literature Sources
Miscellaneous
