

Quantifying activation of perfluorocarbon-based phase-change contrast agents using simultaneous acoustic and optical observation
- PMID: 25656747
- PMCID: PMC5706456
- DOI: 10.1016/j.ultrasmedbio.2014.12.021
Quantifying activation of perfluorocarbon-based phase-change contrast agents using simultaneous acoustic and optical observation
Abstract
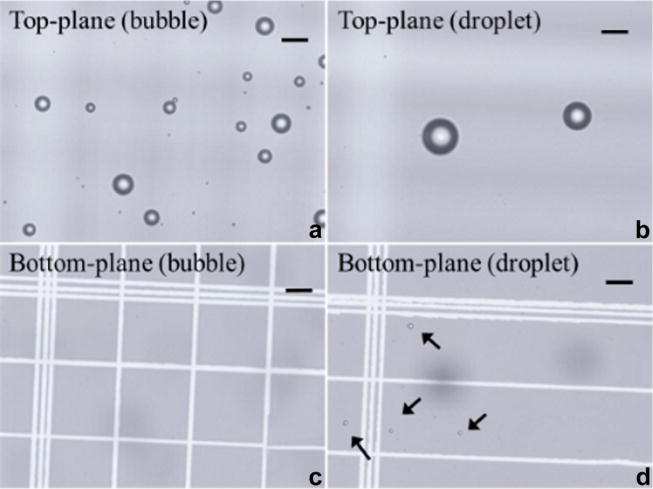
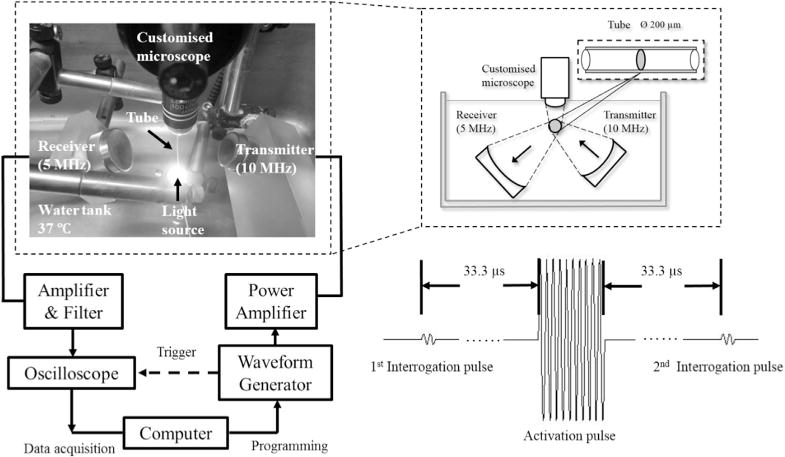
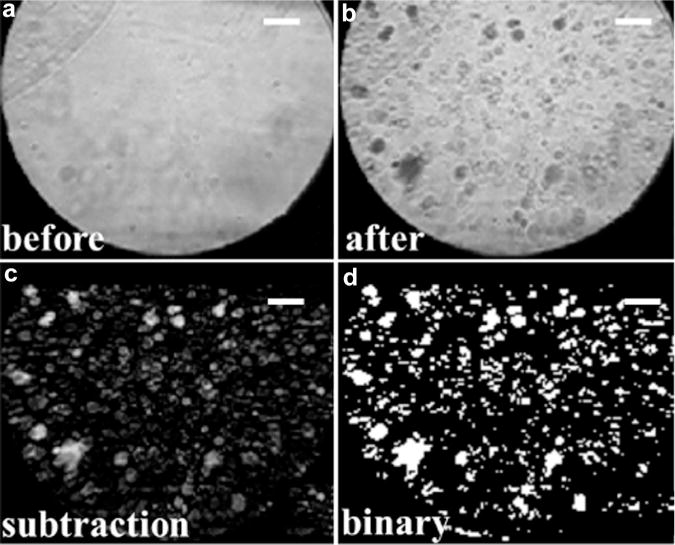
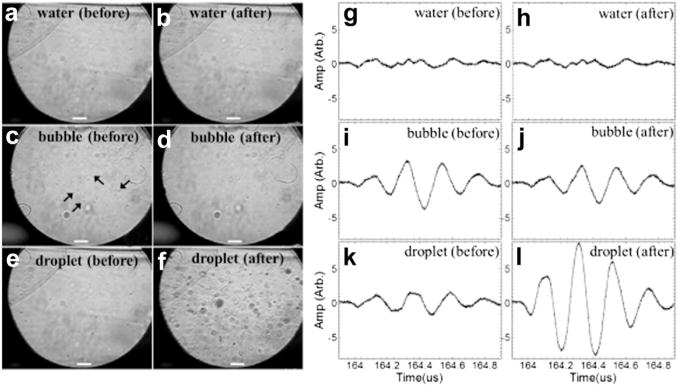
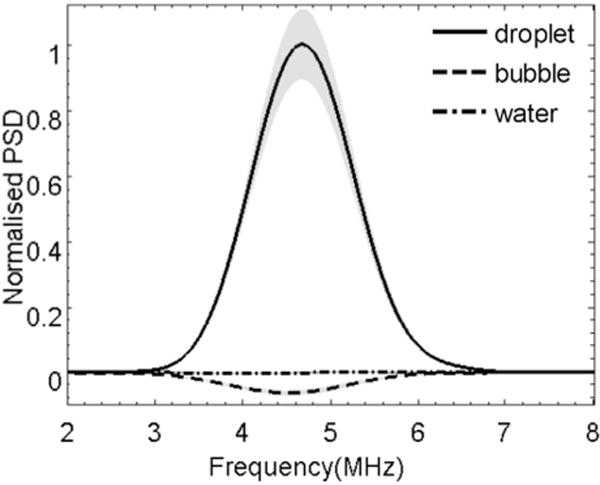
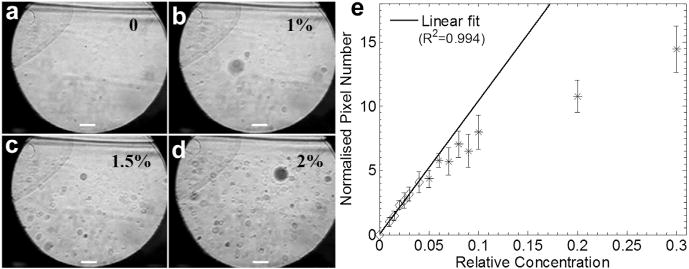
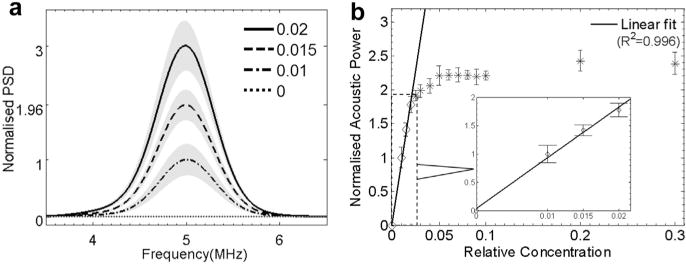
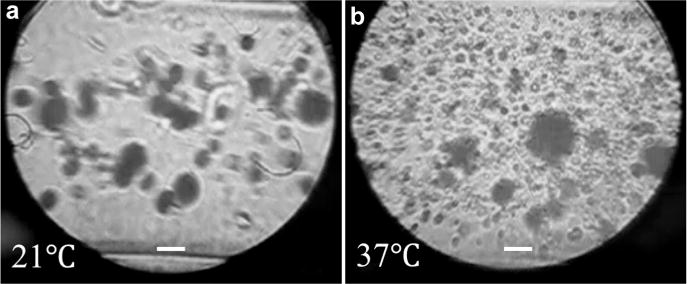
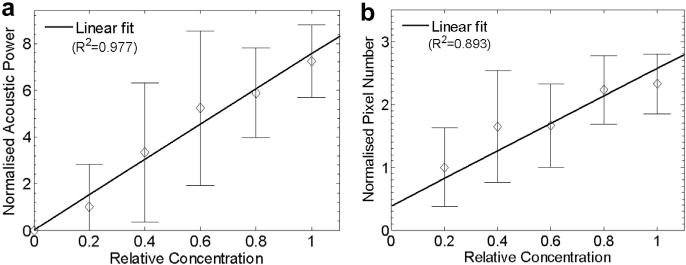
Phase-change contrast agents in the form of nanoscale droplets can be activated into microbubbles by ultrasound, extending the contrast beyond the vasculature. This article describes simultaneous optical and acoustical measurements for quantifying the ultrasound activation of phase-change contrast agents over a range of concentrations. In experiments, decafluorobutane-based nanodroplets of different dilutions were sonicated with a high-pressure activation pulse and two low-pressure interrogation pulses immediately before and after the activation pulse. The differences between the pre- and post-interrogation signals were calculated to quantify the acoustic power scattered by the microbubbles activated over a range of droplet concentrations. Optical observation occurred simultaneously with the acoustic measurement, and the pre- and post-microscopy images were processed to generate an independent quantitative indicator of the activated microbubble concentration. Both optical and acoustic measurements revealed linear relationships to the droplet concentration at a low concentration range <10(8)/mL when measured at body temperature. Further increases in droplet concentration resulted in saturation of the acoustic interrogation signal. Compared with body temperature, room temperature was found to produce much fewer and larger bubbles after ultrasound droplet activation.
Keywords: Acoustic droplet vaporization; Concentration; Contrast agent; Microbubble; Perfluorocarbon droplet; Phase change; Quantification; Temperature.
Copyright © 2015. Published by Elsevier Inc.
Figures
References
-
- Albrecht T, Cosgrove DO, Correas JM, Rallidis L, Nihoyanopoulos P, Patel N. Renal, hepatic, and cardiac enhancement on Doppler and gray-scale sonograms obtained with EchoGen. Acad Radiol. 1996;3(Suppl 2):S198–S200. - PubMed
-
- Coli S, Magnoni M, Sangiorgi G, Marrocco-Trischitta MM, Melisurgo G, Mauriello A, Spagnoli L, Chiesa R, Cianflone D, Maseri A. Contrast-enhanced ultrasound imaging of intraplaque neovascularization in carotid arteriescorrelation with histology and plaque echogenicity. J Am Coll Cardiol. 2008;52:223–230. - PubMed
-
- Correas JM, Meuter AR, Singlas E, Kessler DR, Worah D, Quay SC. Human pharmacokinetics of a perfluorocarbon ultrasound contrast agent evaluated with gas chromatography. Ultrasound Med Biol. 2001;27:565–570. - PubMed
-
- Cosgrove D. Ultrasound contrast agents: An overview. Eur J Radiol. 2006;60:324–330. - PubMed
-
- Cosgrove DO. A revolution in liver ultrasound. Eur J Gastroenterol Hepatol. 2007;19:1–2. - PubMed
Publication types
MeSH terms
Substances
Grants and funding
LinkOut - more resources
Full Text Sources
Other Literature Sources
