. 2015 Feb 4:19:2331216515569792.
doi: 10.1177/2331216515569792.

A fast method for measuring psychophysical thresholds across the cochlear implant array

Affiliations

A fast method for measuring psychophysical thresholds across the cochlear implant array

Julie A Bierer et al. Trends Hear. .

Abstract

A rapid threshold measurement procedure, based on Bekesy tracking, is proposed and evaluated for use with cochlear implants (CIs). Fifteen postlingually deafened adult CI users participated. Absolute thresholds for 200-ms trains of biphasic pulses were measured using the new tracking procedure and were compared with thresholds obtained with a traditional forced-choice adaptive procedure under both monopolar and quadrupolar stimulation. Virtual spectral sweeps across the electrode array were implemented in the tracking procedure via current steering, which divides the current between two adjacent electrodes and varies the proportion of current directed to each electrode. Overall, no systematic differences were found between threshold estimates with the new channel sweep procedure and estimates using the adaptive forced-choice procedure. Test-retest reliability for the thresholds from the sweep procedure was somewhat poorer than for thresholds from the forced-choice procedure. However, the new method was about 4 times faster for the same number of repetitions. Overall the reliability and speed of the new tracking procedure provides it with the potential to estimate thresholds in a clinical setting. Rapid methods for estimating thresholds could be of particular clinical importance in combination with focused stimulation techniques that result in larger threshold variations between electrodes.

Keywords: cochlear implant; psychophysics; threshold.


Figures

Figure 1.
Figure 1.
Schematic of steered QP (left) and MP (right) electrode configurations. QP consists of four adjacent electrodes; two active electrodes and two flanking return electrodes that share a fraction of the return current. The remaining current is delivered to an extracochlear ground electrode. Alpha represents the ratio of current for the two active electrodes. An alpha of 0 (a) indicates all stimulating current is delivered to the more apical electrode (panel a), while an alpha of 1 (c) indicates all current is directed to the basal electrode (panel c). Alpha equal to .5 (b) indicates half of the stimulating current is applied to each of the two active electrodes (panel b). In the MP configurations (right), all of the return current is delivered to the extracochlear ground electrode. Alpha nomenclature is the same for both configurations, and electrodes more apical are to the right.
Figure 2.
Figure 2.
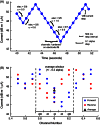
A sample of sweep data over time (A) and across channel numbers (B) for S29. (A) Stimulus level and active electrode number during a portion of a forward sweep. The x-axis is time in seconds and the y-axis is stimulus level in dB re 1 µA. The active electrodes and alpha values are indicated by each pair of symbols. (B) Stimulus level as a function of active channel number for a forward (blue) and reverse (red) sweep. The x-axis is channel number and the y-axis is stimulus level in dB re 1 µA. The gray bar centered at Channel 6 indicates the range of data used for the average threshold estimate (black triangle). The corresponding numbers indicate the weights applied to the data for each channel.
Figure 3.
Figure 3.
A full example of one forward (blue) and one reverse (red) sweep for S29. The x-axis is channel number and the y-axis is stimulus level in dB re 1 µA. The black triangles represent the average threshold estimate for each of the cardinal channel numbers.
Figure 4.
Figure 4.
Detection thresholds measured with 2IFC methods (open) and sweep methods (filled) for all subjects individually. Thresholds for QP are indicated by triangles and MP by circles. Error bars represent ±1 standard deviation and are shown when they exceed the symbol size. The y-axis is stimulus current (dB re: 1 µA) and the x-axis is CI channel from apical to basal.
Figure 5.
Figure 5.
Detection thresholds averaged across all subjects as a function of electrode number for each stimulation mode and procedure. Error bars represent ±1 standard error of the mean. The y-axis is stimulus current (dB re: 1 µA) and the x-axis is CI channel from apical to basal.
Figure 6.
Figure 6.
Comparison of thresholds estimated with 2IFC and sweep methods across all subjects. Each panel plots thresholds estimated by sweep method (y-axis) as a function of 2IFC method (x-axis) for the MP configuration data (left) and QP data (right). R values are based on Pearson’s correlation analysis and were significant with a p < .001.
Figure 7.
Figure 7.
Test–retest reliability for 2IFC (top panels) and sweep (bottom panels) threshold estimates. Threshold estimates from the last two or three runs of the 2IFC procedure (y-axis) are plotted as a function of the first two 2IFC estimates (x-axis) for MP (top left) and QP (top right). Threshold estimates from the second forward and reverse sweep (y-axis) are plotted as a function of the first sweeps (x-axis) for MP (bottom left) and QP (bottom right) configurations. R values are based on Pearson’s correlation analysis and were significant with a p < .001.
Figure 8.
Figure 8.
Duration of testing for sweep (open) and 2IFC (filled) methods. Each pair of bars represent data for one subject and data averaged across subjects is the rightmost pair of each panel. Error bars represent the standard deviation. The height of the bar indicates the time it took (in minutes) to complete threshold estimates for each subject using the sweep and 2IFC procedures. Data are shown for MP (top) and QP (bottom).
Figure 9.
Figure 9.
Comparison of threshold estimates using the 2IFC procedure with steered QP and pTP configurations. Left panels represent pTP thresholds (x-axis) versus QP thresholds with an alpha of one (top) and zero (bottom). The lower right panel shows threshold estimates for steered QP with alpha of 1 (x-axis) and alpha of zero (y-axis). R values are based on Pearson’s correlation analysis and were significant (p < .001).

References

    1. Berenstein C. K., Mens L. H., Mulder J. J., Vanpoucke F. J. (2008) Current steering and current focusing in cochlear implants: comparison of monopolar, tripolar and virtual channel electrode configurations. Ear and Hearing 29: 250–260. - PubMed
    1. Bierer J. A. (2007) Threshold and channel interaction in cochlear implant users: Evaluation of the tripolar electrode configuration. Journal of the Acoustical Society of America 121: 1642–1653. - PubMed
    1. Bierer J. A. (2010) Probing the electrode-neuron interface with focused cochlear implant stimulation. Trends in Amplification 14: 84–95. - PMC - PubMed
    1. Bierer J. A., Faulkner K. F. (2010) Identifying cochlear implant channels with poor electrode–neuron interface: Partial tripolar, single-channel thresholds, and psychophysical tuning curves. Ear and Hearing 31: 247–258. - PMC - PubMed
    1. Bierer J. A., Middlebrooks J. C. (2002) Auditory cortical images of cochlear-implant stimuli: Dependence on electrode configuration. Journal of Neurophysiology 87: 478–492. - PubMed

Publication types

MeSH terms

LinkOut - more resources