

Metabolomic markers of altered nucleotide metabolism in early stage adenocarcinoma
- PMID: 25657018
- PMCID: PMC4618700
- DOI: 10.1158/1940-6207.CAPR-14-0329
Metabolomic markers of altered nucleotide metabolism in early stage adenocarcinoma
Abstract
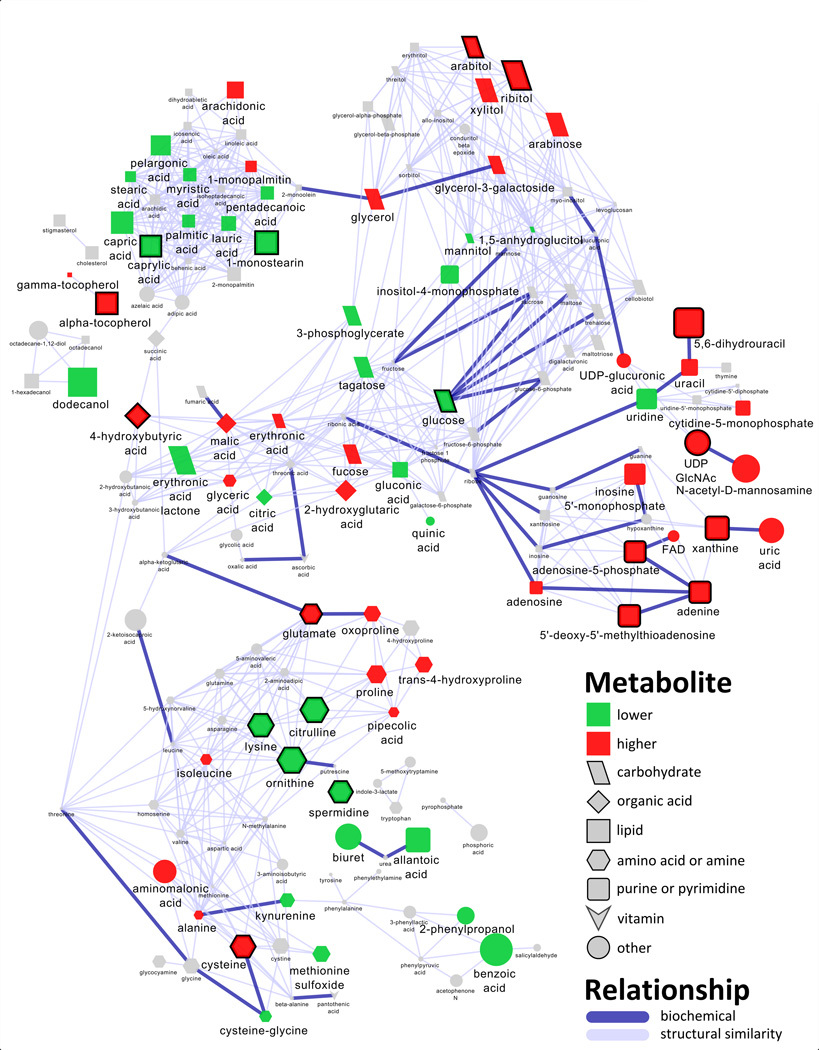
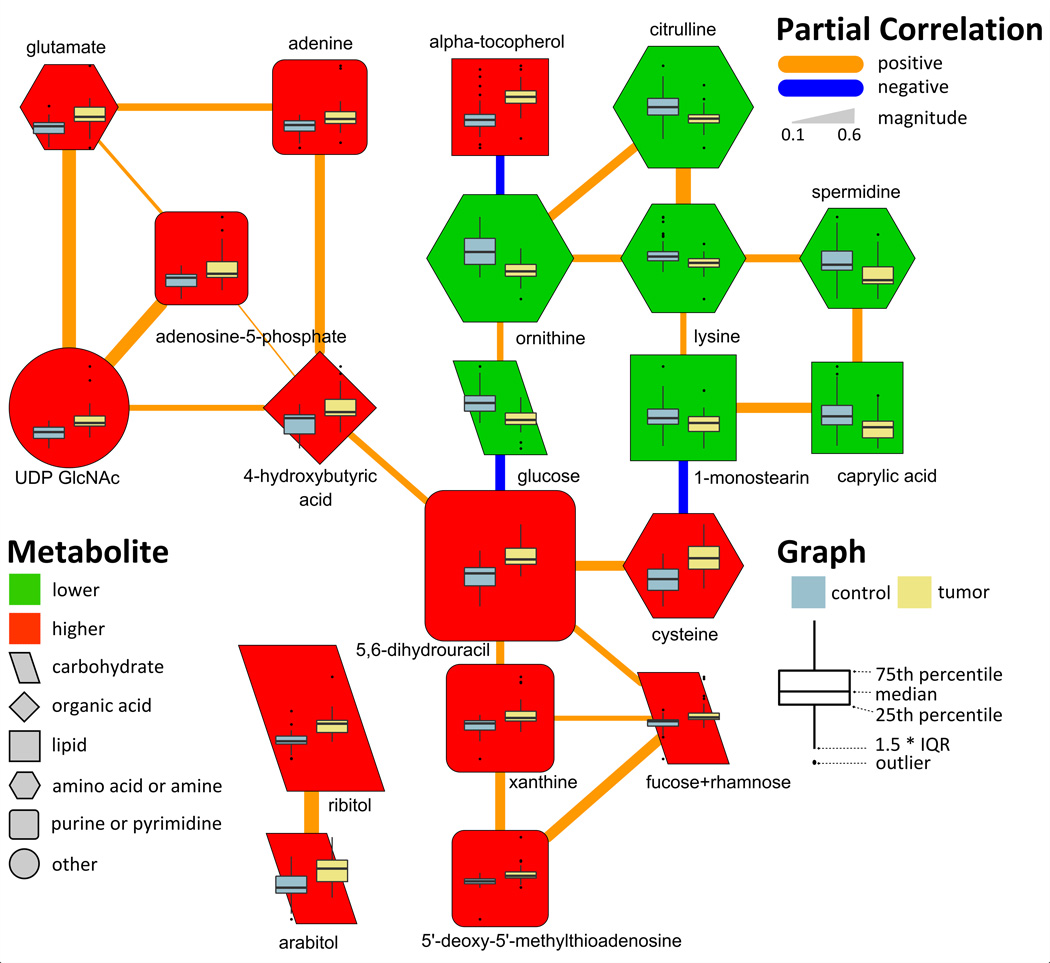
Adenocarcinoma, a type of non-small cell lung cancer, is the most frequently diagnosed lung cancer and the leading cause of lung cancer mortality in the United States. It is well documented that biochemical changes occur early in the transition from normal to cancer cells, but the extent to which these alterations affect tumorigenesis in adenocarcinoma remains largely unknown. Herein, we describe the application of mass spectrometry and multivariate statistical analysis in one of the largest biomarker research studies to date aimed at distinguishing metabolic differences between malignant and nonmalignant lung tissue. Gas chromatography time-of-flight mass spectrometry was used to measure 462 metabolites in 39 malignant and nonmalignant lung tissue pairs from current or former smokers with early stage (stage IA-IB) adenocarcinoma. Statistical mixed effects models, orthogonal partial least squares discriminant analysis and network integration, were used to identify key cancer-associated metabolic perturbations in adenocarcinoma compared with nonmalignant tissue. Cancer-associated biochemical alterations were characterized by (i) decreased glucose levels, consistent with the Warburg effect, (ii) changes in cellular redox status highlighted by elevations in cysteine and antioxidants, alpha- and gamma-tocopherol, (iii) elevations in nucleotide metabolites 5,6-dihydrouracil and xanthine suggestive of increased dihydropyrimidine dehydrogenase and xanthine oxidoreductase activity, (iv) increased 5'-deoxy-5'-methylthioadenosine levels indicative of reduced purine salvage and increased de novo purine synthesis, and (v) coordinated elevations in glutamate and UDP-N-acetylglucosamine suggesting increased protein glycosylation. The present study revealed distinct metabolic perturbations associated with early stage lung adenocarcinoma, which may provide candidate molecular targets for personalizing therapeutic interventions and treatment efficacy monitoring.
©2015 American Association for Cancer Research.
Conflict of interest statement
Figures
References
-
- Aboud OA, Weiss RH. New opportunities from the cancer metabolome. Clinical chemistry. 2013;59:138–146. - PubMed
-
- Lokhov PG, Trifonova OP, Maslov DL, Archakov AI. Blood plasma metabolites and the risk of developing lung cancer in Russia. European journal of cancer prevention : the official journal of the European Cancer Prevention Organisation. 2013;22:335–341. - PubMed
-
- Rocha CM, Carrola J, Barros AS, Gil AM, Goodfellow BJ, Carreira IM, et al. Metabolic signatures of lung cancer in biofluids: NMR-based metabonomics of blood plasma. Journal of proteome research. 2011;10:4314–4324. - PubMed
-
- Hori S, Nishiumi S, Kobayashi K, Shinohara M, Hatakeyama Y, Kotani Y, et al. A metabolomic approach to lung cancer. Lung cancer. 2011;74:284–292. - PubMed
