. 2015 Apr 1;26(7):1357-70.
doi: 10.1091/mbc.E14-08-1318. Epub 2015 Feb 5.

Spatiotemporal dynamics of membrane remodeling and fusion proteins during endocytic transport

Affiliations

Spatiotemporal dynamics of membrane remodeling and fusion proteins during endocytic transport

Henning Arlt et al. Mol Biol Cell. .

Abstract

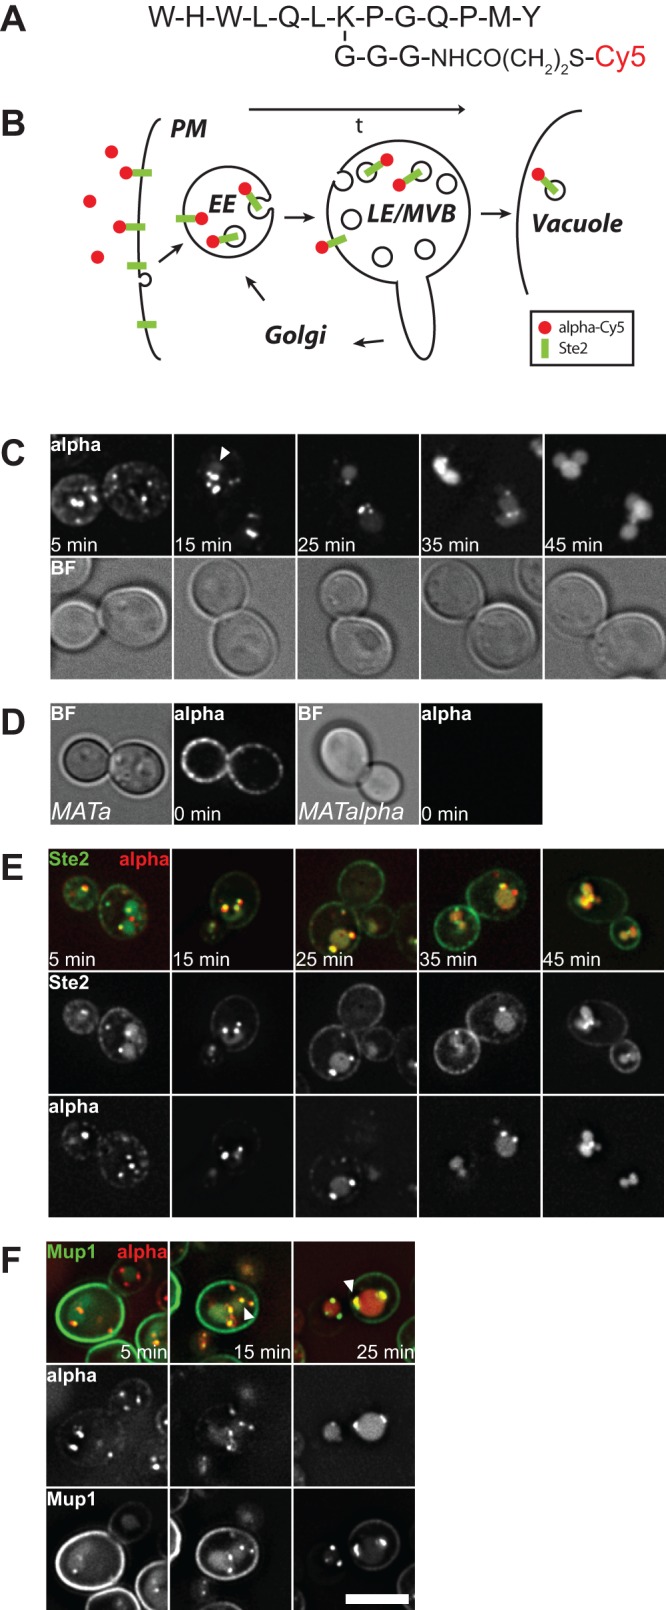
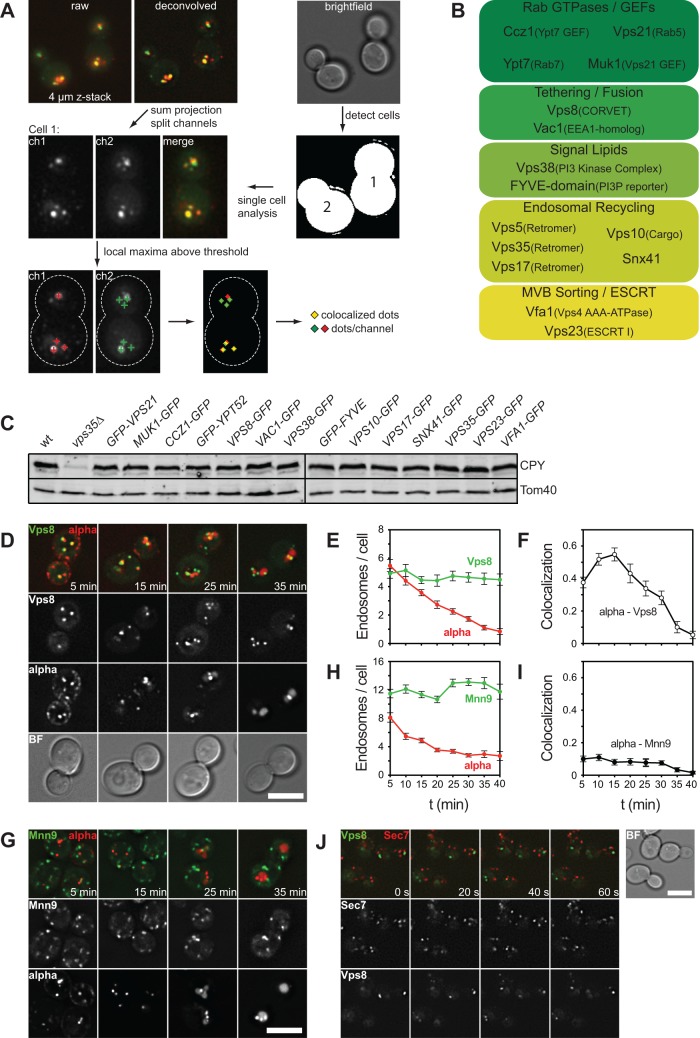
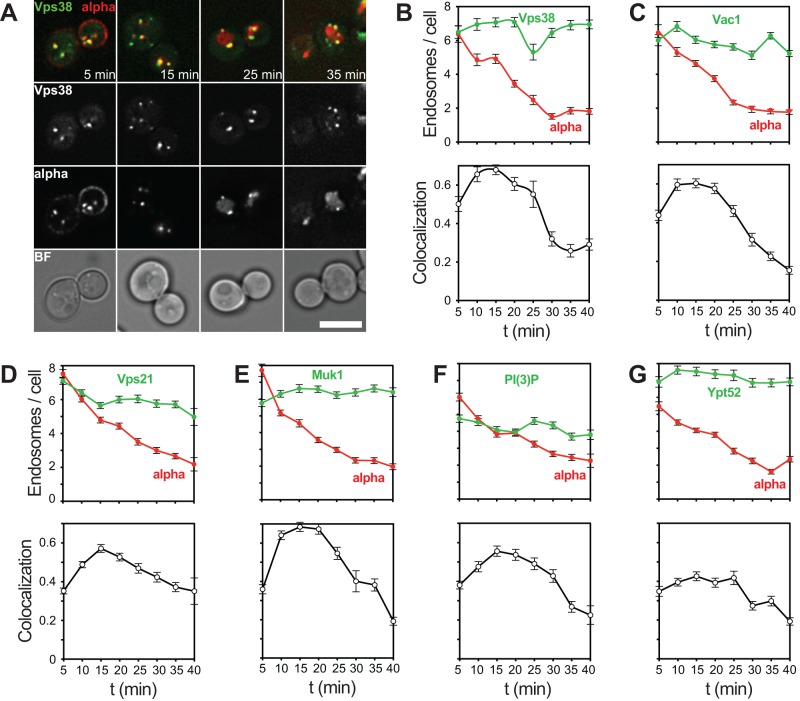
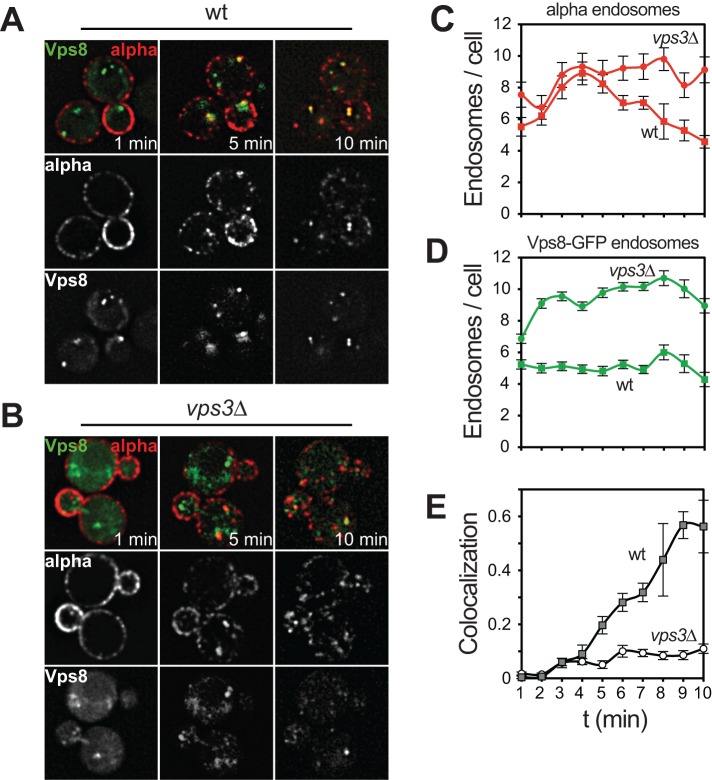
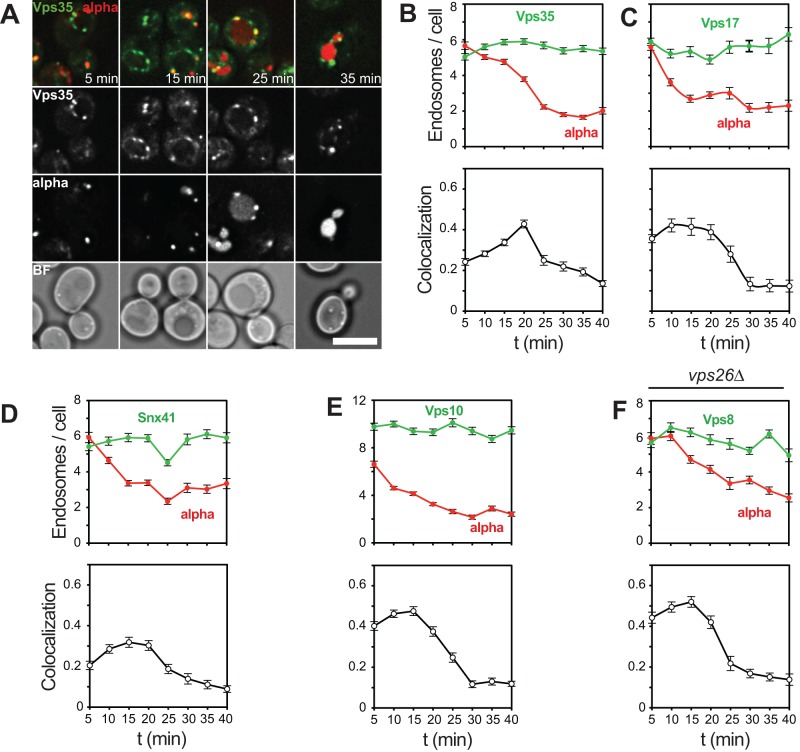
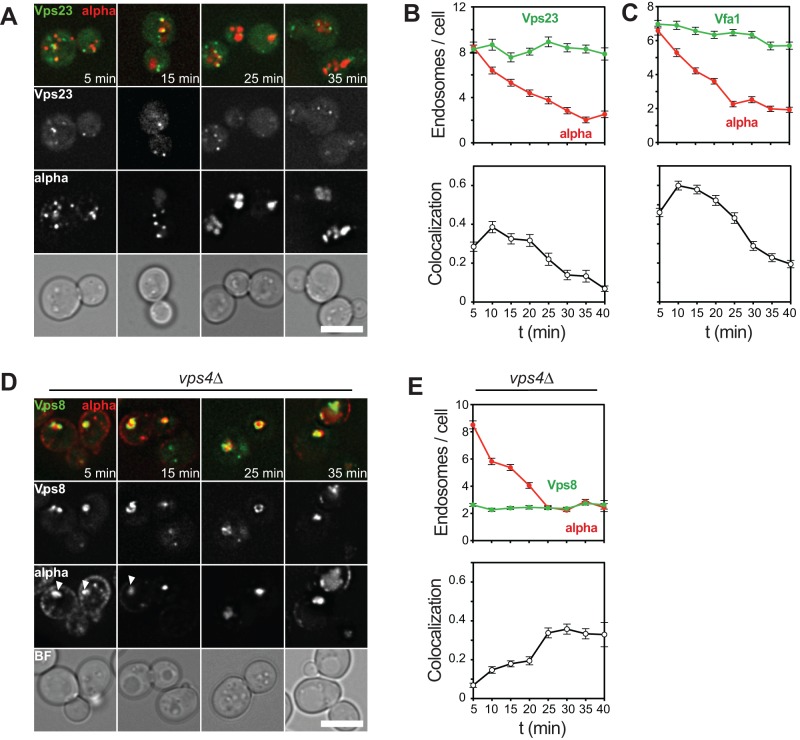
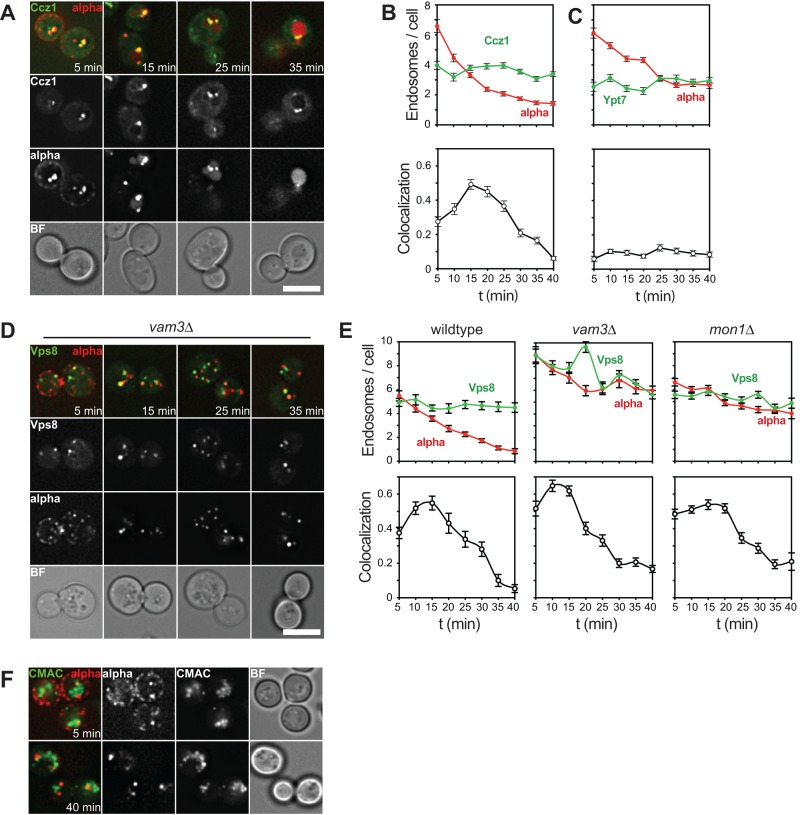
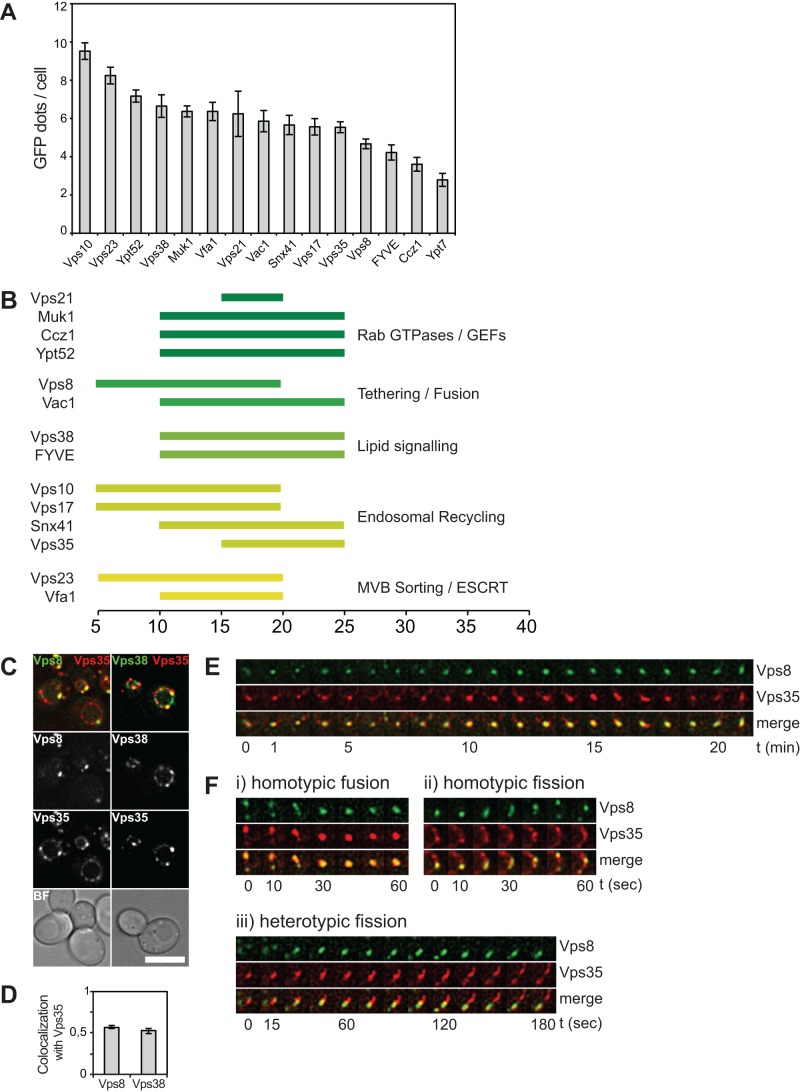
Organelles of the endolysosomal system undergo multiple fission and fusion events to combine sorting of selected proteins to the vacuole with endosomal recycling. This sorting requires a consecutive remodeling of the organelle surface in the course of endosomal maturation. Here we dissect the remodeling and fusion machinery on endosomes during the process of endocytosis. We traced selected GFP-tagged endosomal proteins relative to exogenously added fluorescently labeled α-factor on its way from the plasma membrane to the vacuole. Our data reveal that the machinery of endosomal fusion and ESCRT proteins has similar temporal localization on endosomes, whereas they precede the retromer cargo recognition complex. Neither deletion of retromer nor the fusion machinery with the vacuole affects this maturation process, although the kinetics seems to be delayed due to ESCRT deletion. Of importance, in strains lacking the active Rab7-like Ypt7 or the vacuolar SNARE fusion machinery, α-factor still proceeds to late endosomes with the same kinetics. This indicates that endosomal maturation is mainly controlled by the early endosomal fusion and remodeling machinery but not the downstream Rab Ypt7 or the SNARE machinery. Our data thus provide important further understanding of endosomal biogenesis in the context of cargo sorting.


Figures

FIGURE 1:
FIGURE 1:
Dynamics of α-factor trafficking through the endocytic pathway. (A) Schematic representation of α-factor peptide sequence including a linker at the central lysine for dye labeling. (B) Model of α-factor and Ste2 trafficking to analyze the endocytic pathway. (C) Wild-type cells were grown in synthetic medium supplemented with amino acids to logarithmic phase, cooled to 4°C to block endocytosis, treated with fluorescent α-factor, washed, and resuspended in medium at 23°C to allow uptake of the probe. Indicated time points refer to the time interval after cells were heated to 23°C. White arrows indicate first appearance of vacuolar Cy5 staining. (D) Uptake of α-factor depends on cell mating type. Cells were treated as in C and analyzed in the microscope directly after washing at 4°C. (E) α-Factor and its receptor Ste2 colocalize during passage through the endocytic pathway. Cells expressing endogenously tagged Ste2-GFP were treated as in C and analyzed in the fluorescence microscope. (F) Mup1 and α-Cy5 are transported through the same endosomes. Cells were grown in synthetic medium without methionine to accumulate endogenously expressed Mup1-3xmCherry at the plasma membrane. Cells were then treated as in C and resuspended in medium containing 1 mM methionine at 23°C to allow endocytosis and trigger Mup1 uptake. White arrows indicate Mup1 and α-Cy5 colocalizing endosomes. BF, bright field; scale bar, 5 μm.
FIGURE 2:
FIGURE 2:
Spatiotemporal analysis of protein (co)localization on endosomes. (A) Workflow to measure colocalization of α-factor on endosomes. We acquired and deconvolved 4-μm z-stacks with 400-nm spacing of the fluorescence channels. A bright-field image of the same image section was used to segment single yeast cells. A sum projection of the deconvolved image stack was used to detect local intensity maxima in each channel in every cell to colocalize and quantify the respective dots per cell (see Materials and Methods). (B) Schematic representation of 16 proteins chosen for analysis of the endocytic pathway, categorized by function. (C) All tagged constructs are functional. Trafficking of CPY was monitored by analysis of internal CPY content using antibodies against CPY and Tom40 as loading control on whole-cell extracts. (D) α-Factor uptake assay in cells expressing endogenously tagged VPS8-GFP. Cells were analyzed as in Figure 1C. (E, F) Quantification of α-Cy5 uptake assay shown in D. Endosome number per cell (E) and colocalization of endosomes in the Cy5 and GFP channels (F) were quantified using the ImageJ plug-in described in A. Colocalization represents the fraction of Cy5-labeled α-factor endosomes per cell that are colocalized with the GFP channel or (colocalized endosomes per cell)/(Cy5-positive endosomes per cell) at the respective time points of the assay. (G) α-Factor uptake assay was carried out as in D in cells expressing endogenous Mnn9-GFP. (H, I) Quantification of uptake assay shown in G as in E and F. (J) Analysis of dynamic colocalization of endosome and Golgi markers. Cells expressing endogenous Vps8-GFP and Sec7-mCherry were grown as described for the α-uptake assay and analyzed by time-lapse microscopy in 20-s intervals. Graphs show mean values and SEM. BF, bright field; scale bars, 5 μm.
FIGURE 3:
FIGURE 3:
Analysis of proteins involved in early endosomal fusion and PI3P generation. (A) α-Factor uptake assay in cells expressing endogenously tagged Vps38-GFP. Experiment was carried out as described in Figure 1C (see Materials and Methods). (B) Quantification of uptake assay shown in A. (C–G) Quantification of α-factor uptake assay in cells expressing GFP-tagged Vac1, Muk1, Vps21, Ypt52, and FYVE domain. Scale bars, 5 μm.
FIGURE 4:
FIGURE 4:
Analysis of the first 10 min of the endocytic pathway. (A, B) α-Factor uptake assay in cells expressing Vps8-GFP in the wild type (A) or vps3∆ mutant (B). Experiment was carried out as in Figure 1C, but cells were directly spotted on cover slides for microscopy after washing in cold medium without incubation at 23°C. The same image section was analyzed for 10 min. (C–E) Quantification of the experiment in A and B as in Figure 2. Graphs show mean values ± SEM. Scale bars, 5 μm.
FIGURE 5:
FIGURE 5:
Mapping of proteins involved in endosomal recycling. (A) α-Factor uptake assay in cells expressing endogenous Vps35-GFP. Experiment was carried out as in Figure 1C (see Materials and Methods). (B) Quantification of assay shown in A as described in Figure 2. (C–F) Quantification of α-factor uptake assay in cells expressing GFP-tagged Vps17, Snx41, and Vps10 in wild-type cells or Vps8-GFP in vps26∆ cells. (B–F) Mean values ± SEM. Scale bar, 5 μm.
FIGURE 6:
FIGURE 6:
Endosomal localization of proteins involved in ESCRT sorting. (A) Uptake assay of labeled α-factor in cells expressing Vps23-GFP. Experiment was carried out as described in Figure 1C. (B) Quantification of α-factor uptake assay shown in A as described in Figure 2. (C) α-Factor uptake assay and quantification of cells expressing Vfa1-GFP. (D, E) Cells expressing GFP-tagged Vps8 in vps4∆ cells were analyzed as in A and B. White arrows indicate class E compartments at early time points. Graphs show mean values ± SEM; scale bars, 5 μm.
FIGURE 7:
FIGURE 7:
A block of endosome–vacuole fusion does not affect endosomal maturation. (A) α-Factor uptake assay in cells expressing Ccz1-GFP, a subunit of the Ypt7 GEF complex. (B) The experiment in A was quantified as described in Figure 2. (C) The assay described in A was carried out in cells expressing GFP-tagged Ypt7. (D) Cells expressing Vps8-GFP in a vam3∆ background were analyzed as in A. (E) Quantification of α-factor uptake assays carried out in cells expressing Vps8-GFP in the wild type (left) and vam3∆ (middle) or mon1∆ (right) mutant. (F) Uptake assay as in D with additional CMAC staining of the vacuolar lumen (see Materials and Methods). Graphs show mean values ± SEM. Scale bars, 5 μm.
FIGURE 8:
FIGURE 8:
Model of endosomal maturation in yeast. (A) Data from α-factor uptake assays were used to calculate average number of endosomes per cell with respect to analyzed endosomal proteins. Graphs show mean values ± SD. (B) Colocalization pattern of analyzed endosomal proteins. All colocalization patterns obtained with the α-factor uptake assay were normalized, and a threshold was used to show the time points with most colocalization. (C) Localization of endogenous Vps8-GFP or Vps38-GFP with Vps35 tagged with 3xmCherry. (D) Colocalization in C was analyzed as in Figure 2A. Graph shows mean values ± SEM. (E, F) Tracking of single endosomes in cells expressing Vps8-GFP and Vps35-3xmCherry. The z-stacks were acquired every 10–15 s over a time period of 40 min, followed by deconvolution, sum projection, and bleach correction using ImageJ. Endosomes were tracked manually.

References

    1. Arlt H, Perz A, Ungermann C. An overexpression screen in Saccharomyces cerevisiae identifies novel genes that affect endocytic protein trafficking. Traffic. 2011;12:1592–1603. - PubMed
    1. Babst M, Sato TK, Banta LM, Emr SD. Endosomal transport function in yeast requires a novel AAA-type ATPase, Vps4p. EMBO J. 1997;16:1820–1831. - PMC - PubMed
    1. Balderhaar HJK, Arlt H, Ostrowicz CW, Bröcker C, Sündermann F, Brandt R, Babst M, Ungermann C. The Rab GTPase Ypt7 is linked to retromer-mediated receptor recycling and fusion at the yeast late endosome. J Cell Sci. 2010;123:4085–4094. - PubMed
    1. Balderhaar HJK, Lachmann J, Yavavli E, Bröcker C, Lürick A, Ungermann C. The CORVET complex promotes tethering and fusion of Rab5/Vps21-positive membranes. Proc Natl Acad Sci USA. 2013;110:3823–3828. - PMC - PubMed
    1. Balderhaar HJK, Ungermann C. CORVET and HOPS tethering complexes—coordinators of endosome and lysosome fusion. J Cell Sci. 2013;126:1307–1316. - PubMed

Publication types

MeSH terms

Substances

LinkOut - more resources