

Nonparametric Tests for Differential Histone Enrichment with ChIP-Seq Data
- PMID: 25657574
- PMCID: PMC4310510
- DOI: 10.4137/CIN.S13972
Nonparametric Tests for Differential Histone Enrichment with ChIP-Seq Data
Abstract
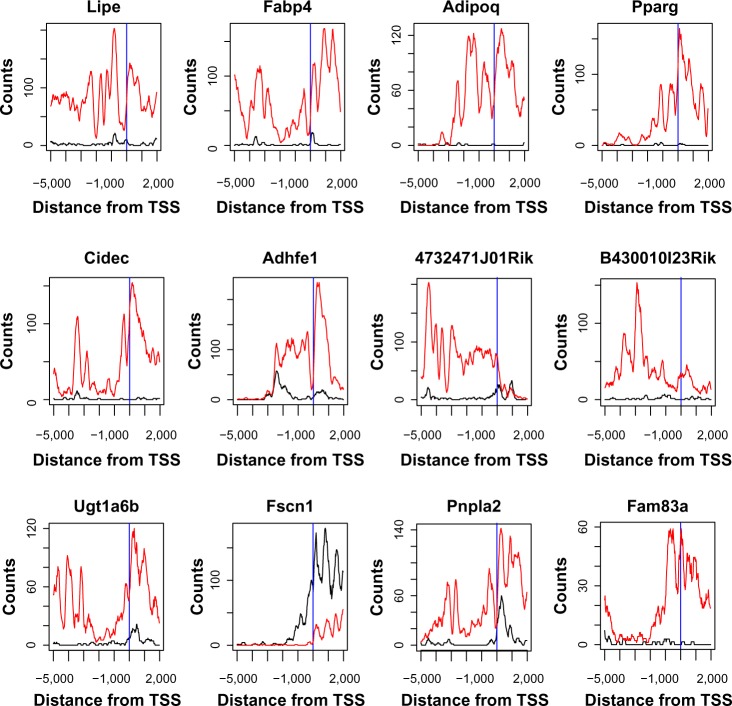
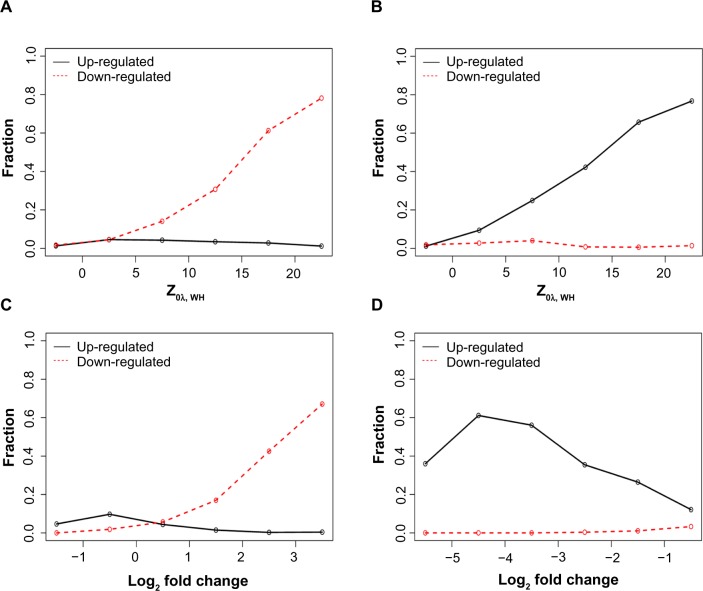
Chromatin immunoprecipitation sequencing (ChIP-seq) is a powerful method for analyzing protein interactions with DNA. It can be applied to identify the binding sites of transcription factors (TFs) and genomic landscape of histone modification marks (HMs). Previous research has largely focused on developing peak-calling procedures to detect the binding sites for TFs. However, these procedures may fail when applied to ChIP-seq data of HMs, which have diffuse signals and multiple local peaks. In addition, it is important to identify genes with differential histone enrichment regions between two experimental conditions, such as different cellular states or different time points. Parametric methods based on Poisson/negative binomial distribution have been proposed to address this differential enrichment problem and most of these methods require biological replications. However, many ChIP-seq data usually have a few or even no replicates. We propose a nonparametric method to identify the genes with differential histone enrichment regions even without replicates. Our method is based on nonparametric hypothesis testing and kernel smoothing in order to capture the spatial differences in histone-enriched profiles. We demonstrate the method using ChIP-seq data on a comparative epigenomic profiling of adipogenesis of murine adipose stromal cells and the Encyclopedia of DNA Elements (ENCODE) ChIP-seq data. Our method identifies many genes with differential H3K27ac histone enrichment profiles at gene promoter regions between proliferating preadipocytes and mature adipocytes in murine 3T3-L1 cells. The test statistics also correlate with the gene expression changes well and are predictive to gene expression changes, indicating that the identified differentially enriched regions are indeed biologically meaningful.
Keywords: kernel smoothing; nonparametric testing; normalization; spatial histone profiles.
Figures


Similar articles
-
Revealing transcription factor and histone modification co-localization and dynamics across cell lines by integrating ChIP-seq and RNA-seq data.BMC Genomics. 2018 Dec 31;19(Suppl 10):914. doi: 10.1186/s12864-018-5278-5. BMC Genomics. 2018. PMID: 30598100 Free PMC article.
-
QChIPat: a quantitative method to identify distinct binding patterns for two biological ChIP-seq samples in different experimental conditions.BMC Genomics. 2013;14 Suppl 8(Suppl 8):S3. doi: 10.1186/1471-2164-14-S8-S3. Epub 2013 Dec 9. BMC Genomics. 2013. PMID: 24564479 Free PMC article.
-
Role of ChIP-seq in the discovery of transcription factor binding sites, differential gene regulation mechanism, epigenetic marks and beyond.Cell Cycle. 2014;13(18):2847-52. doi: 10.4161/15384101.2014.949201. Cell Cycle. 2014. PMID: 25486472 Free PMC article. Review.
-
MMDiff: quantitative testing for shape changes in ChIP-Seq data sets.BMC Genomics. 2013 Nov 24;14:826. doi: 10.1186/1471-2164-14-826. BMC Genomics. 2013. PMID: 24267901 Free PMC article.
-
A clustering approach for identification of enriched domains from histone modification ChIP-Seq data.Bioinformatics. 2009 Aug 1;25(15):1952-8. doi: 10.1093/bioinformatics/btp340. Epub 2009 Jun 8. Bioinformatics. 2009. PMID: 19505939 Free PMC article.
Cited by
-
Inaccessible LCG Promoters Act as Safeguards to Restrict T Cell Development to Appropriate Notch Signaling Environments.Stem Cell Reports. 2021 Apr 13;16(4):717-726. doi: 10.1016/j.stemcr.2021.02.017. Epub 2021 Mar 25. Stem Cell Reports. 2021. PMID: 33770495 Free PMC article.
References
-
- Johnson D, Mortazavi A, Myers R, Wold B. Genome-wide mapping of in vivoprotein-DNA interactions. Science. 2007;316:1497. - PubMed
-
- Mortazavi A, Williams B, McCue K, Schaeffer L, Wold B. Mapping and quantifying mammalian transcriptomes by RNA-Seq. Nat Methods. 2008;5:621–8. - PubMed
-
- Barski A, Cuddapah S, Cui K, et al. High-resolution profiling of histone methylations in the human genome. Cell. 2007;129:823–37. - PubMed
Grants and funding
LinkOut - more resources
Full Text Sources
