

Vision under mesopic and scotopic illumination
- PMID: 25657632
- PMCID: PMC4302711
- DOI: 10.3389/fpsyg.2014.01594
Vision under mesopic and scotopic illumination
Abstract
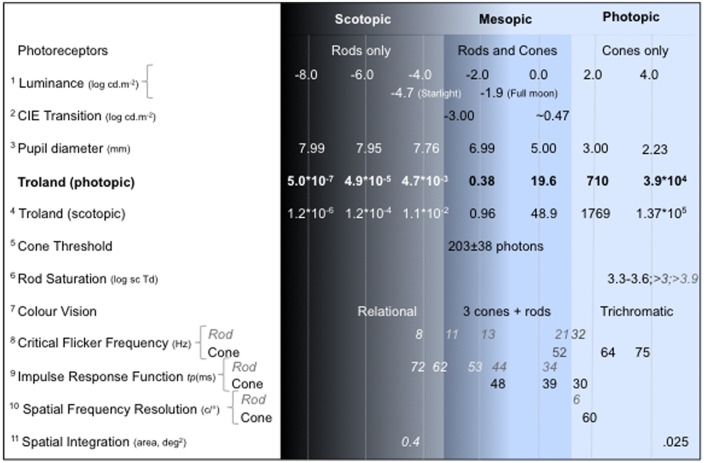
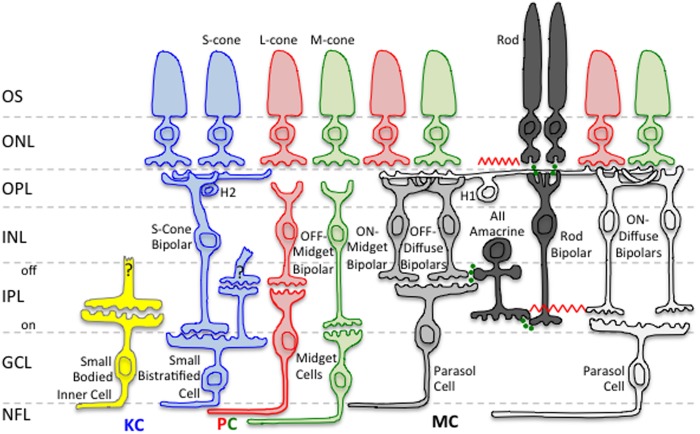
Evidence has accumulated that rod activation under mesopic and scotopic light levels alters visual perception and performance. Here we review the most recent developments in the measurement of rod and cone contributions to mesopic color perception and temporal processing, with a focus on data measured using a four-primary photostimulator method that independently controls rod and cone excitations. We discuss the findings in the context of rod inputs to the three primary retinogeniculate pathways to understand rod contributions to mesopic vision. Additionally, we present evidence that hue perception is possible under scotopic, pure rod-mediated conditions that involves cortical mechanisms.
Keywords: color; cones; mesopic; photopic; rods; scotopic; temporal; vision.
Figures
Similar articles
-
Rod Photoresponse Kinetics Limit Temporal Contrast Sensitivity in Mesopic Vision.J Neurosci. 2019 Apr 17;39(16):3041-3056. doi: 10.1523/JNEUROSCI.1404-18.2019. Epub 2019 Feb 8. J Neurosci. 2019. PMID: 30737308 Free PMC article.
-
Selective Automated Perimetry Under Photopic, Mesopic, and Scotopic Conditions: Detection Mechanisms and Testing Strategies.Transl Vis Sci Technol. 2016 May 20;5(3):10. doi: 10.1167/tvst.5.3.10. eCollection 2016 May. Transl Vis Sci Technol. 2016. PMID: 27247858 Free PMC article.
-
Mesopic luminance assessed with minimum motion photometry.J Vis. 2011 Aug 25;11(9):14. doi: 10.1167/11.9.14. J Vis. 2011. PMID: 21868482
-
Into the twilight zone: the complexities of mesopic vision and luminous efficiency.Ophthalmic Physiol Opt. 2006 May;26(3):225-39. doi: 10.1111/j.1475-1313.2006.00325.x. Ophthalmic Physiol Opt. 2006. PMID: 16684149 Review.
-
Parallel Processing of Rod and Cone Signals: Retinal Function and Human Perception.Annu Rev Vis Sci. 2018 Sep 15;4:123-141. doi: 10.1146/annurev-vision-091517-034055. Epub 2018 Jun 8. Annu Rev Vis Sci. 2018. PMID: 29883274 Free PMC article. Review.
Cited by
-
Unraveling the functional signals of rods and cones in the human retina: separation and analysis.Front Ophthalmol (Lausanne). 2024 Apr 8;4:1340692. doi: 10.3389/fopht.2024.1340692. eCollection 2024. Front Ophthalmol (Lausanne). 2024. PMID: 38984116 Free PMC article.
-
A five-primary Maxwellian-view display for independent control of melanopsin, rhodopsin, and three-cone opsins on a fine spatial scale.J Vis. 2022 Nov 1;22(12):20. doi: 10.1167/jov.22.12.20. J Vis. 2022. PMID: 36445714 Free PMC article.
-
An Event-related Potential Study on the Interaction between Lighting Level and Stimulus Spatial Location.Front Hum Neurosci. 2015 Nov 24;9:637. doi: 10.3389/fnhum.2015.00637. eCollection 2015. Front Hum Neurosci. 2015. PMID: 26635588 Free PMC article.
-
Age-Related Changes in Mesopic Reading Vision Across Adulthood.Invest Ophthalmol Vis Sci. 2025 Mar 3;66(3):40. doi: 10.1167/iovs.66.3.40. Invest Ophthalmol Vis Sci. 2025. PMID: 40111357 Free PMC article.
-
The mechanism of human color vision and potential implanted devices for artificial color vision.Front Neurosci. 2024 Jun 19;18:1408087. doi: 10.3389/fnins.2024.1408087. eCollection 2024. Front Neurosci. 2024. PMID: 38962178 Free PMC article. Review.
References
-
- Aguilar M., Stiles W. S. (1954). Saturation of the rod mechanism of the retina at high levels of illumination. Opt. Acta 1 59–65 10.1080/713818657 - DOI
-
- Ambler B. A. (1974). Hue discrimination in peripheral vision under conditions of dark and light adaptation. Percept. Psychophys. 15 586–590 10.3758/BF03199306 - DOI
Publication types
Grants and funding
LinkOut - more resources
Full Text Sources
Other Literature Sources