

Effect of p62 on tau hyperphosphorylation in a rat model of Alzheimer's disease
- PMID: 25657660
- PMCID: PMC4308800
- DOI: 10.3969/j.issn.1673-5374.2012.17.004
Effect of p62 on tau hyperphosphorylation in a rat model of Alzheimer's disease
Abstract
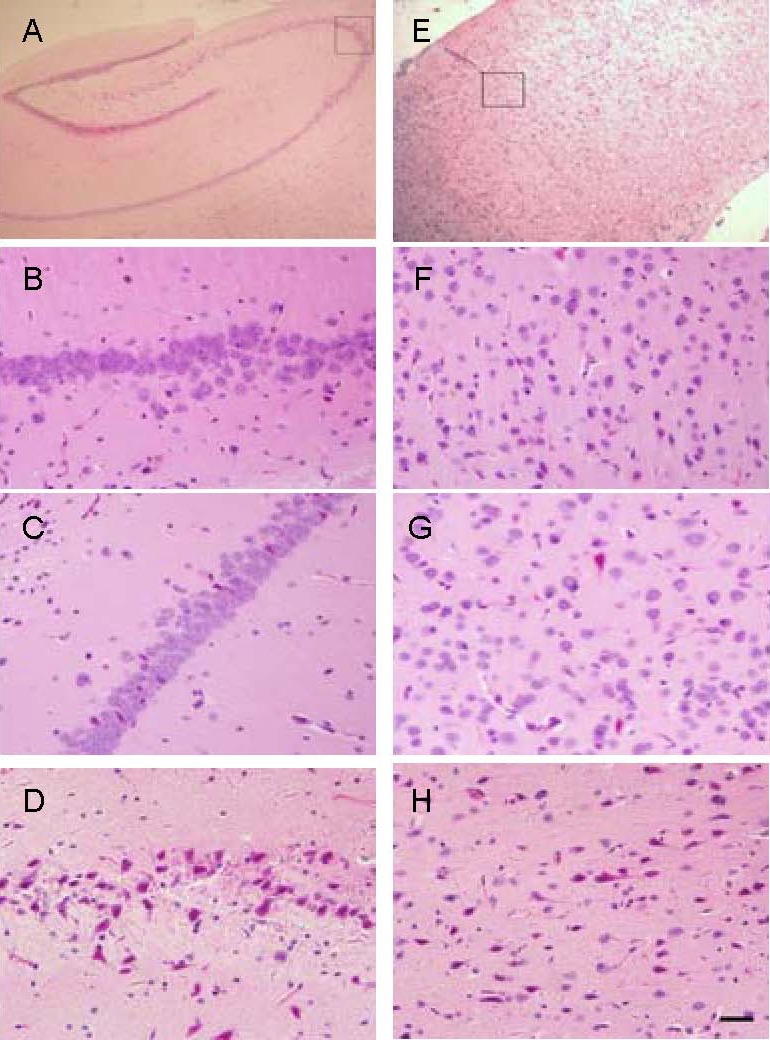
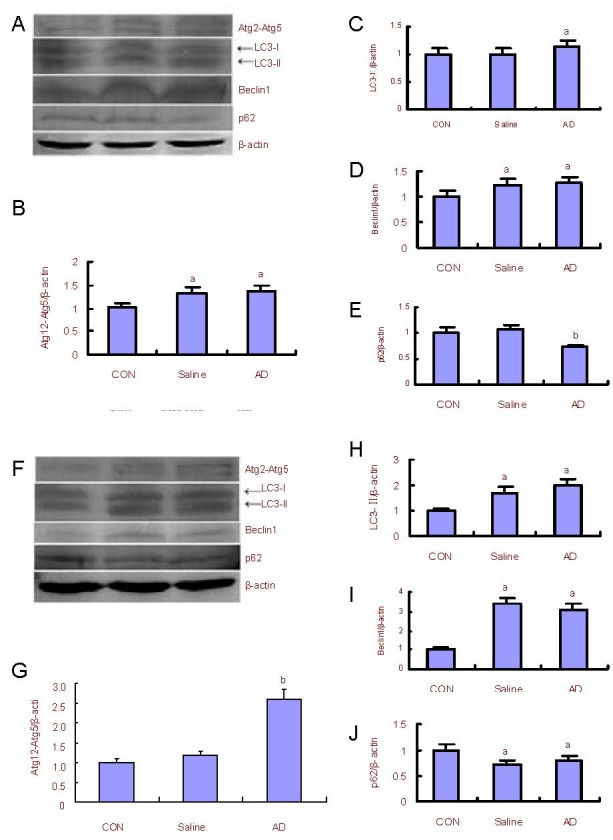
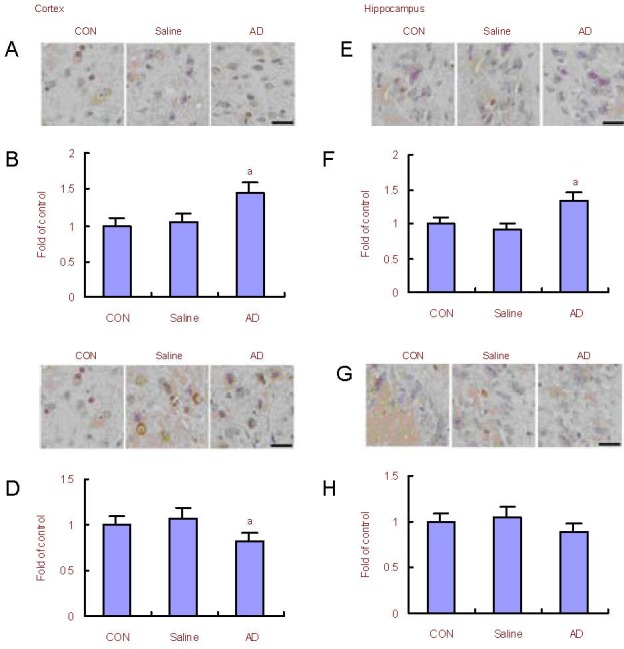
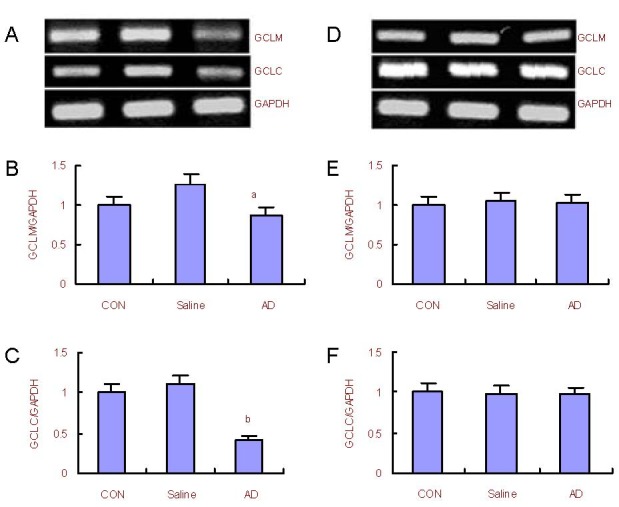
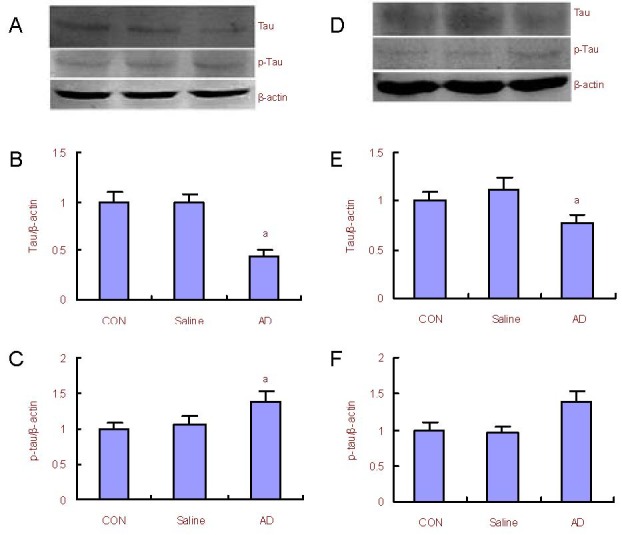
Tau hyperphosphorylation is a main cause of neuronal loss in Alzheimer's disease, which can be caused by many factors, including oxidative stress. The multifunctional protein p62, which exists in neurofibrillary tangles and causes aggregation of hyperphosphorylated tau, not only serves as a receptor in selective autophagy, but also regulates oxidative stress. However, whether p62 participates in oxidative stress-induced tau hyperphosphorylation remains unclear. In this study, we produced an Alzheimer's disease rat model by injecting β-amyloid protein into the hippocampus and β-galactose intraperitoneally. Hematoxylin-eosin staining was used for morphological analysis of brain tissue, and western blotting, immunohistochemistry and reverse transcription-PCR were employed to study p62 and autophagy related proteins, antioxidant defense system kelch-like ECH-associated protein 1-NF-E2-related factor 2 related proteins and hyperphosphorylated tau, respectively. The number of neurons in the brain decreased in Alzheimer's disease rats, and the autophagy related proteins Atg12-Atg5, microtubule-associated protein 1 light chain 3-phosphatidylethanolamine and Beclin1 increased significantly, while p62 expression reduced. Expression of kelch-like ECH-associated protein 1 increased, NF-E2-related factor 2 protein and the downstream gene products of glutamate cysteine ligase catalytic subunit and glutamate cysteine ligase modulatory subunit decreased, and hyperphosphorylated tau increased. These findings demonstrate that autophagy levels increased and p62 levels decreased in the brains of Alzheimer's disease rats. Moreover, the anti-oxidative capability of the NF-E2-related factor 2-antioxidant response element pathway was decreased, which may be the cause of tau hyperphosphorylation in Alzheimer's disease brain tissue and the subsequent structural and functional damage to neurons.
Keywords: Alzheimer's disease; NF-E2-related factor 2; autophagy; neural regeneration; p62; tau hyperphosphorylation.
Conflict of interest statement
Figures
Similar articles
-
Selenomethionine Mitigates Cognitive Decline by Targeting Both Tau Hyperphosphorylation and Autophagic Clearance in an Alzheimer's Disease Mouse Model.J Neurosci. 2017 Mar 1;37(9):2449-2462. doi: 10.1523/JNEUROSCI.3229-16.2017. Epub 2017 Jan 30. J Neurosci. 2017. PMID: 28137967 Free PMC article.
-
The Ambiguous Relationship of Oxidative Stress, Tau Hyperphosphorylation, and Autophagy Dysfunction in Alzheimer's Disease.Oxid Med Cell Longev. 2015;2015:352723. doi: 10.1155/2015/352723. Epub 2015 Jun 15. Oxid Med Cell Longev. 2015. PMID: 26171115 Free PMC article. Review.
-
Hyperphosphorylated tau targeting human serum albumin Fusion protein as therapeutics for Alzheimer's diseases.IBRO Neurosci Rep. 2024 Nov 7;17:423-430. doi: 10.1016/j.ibneur.2024.11.005. eCollection 2024 Dec. IBRO Neurosci Rep. 2024. PMID: 39634029 Free PMC article.
-
Emerging role of p62/sequestosome-1 in the pathogenesis of Alzheimer's disease.Prog Neurobiol. 2012 Jan;96(1):87-95. doi: 10.1016/j.pneurobio.2011.11.005. Epub 2011 Nov 22. Prog Neurobiol. 2012. PMID: 22138392 Review.
-
Effect of treadmill exercise on PI3K/AKT/mTOR, autophagy, and Tau hyperphosphorylation in the cerebral cortex of NSE/htau23 transgenic mice.J Exerc Nutrition Biochem. 2015 Sep;19(3):199-209. doi: 10.5717/jenb.2015.15090806. Epub 2015 Sep 30. J Exerc Nutrition Biochem. 2015. PMID: 26527331 Free PMC article.
Cited by
-
PLK2-mediated phosphorylation of SQSTM1 S349 promotes aggregation of polyubiquitinated proteins upon proteasomal dysfunction.Autophagy. 2024 Oct;20(10):2221-2237. doi: 10.1080/15548627.2024.2361574. Epub 2024 Jun 19. Autophagy. 2024. PMID: 39316746 Free PMC article.
-
p62-Nrf2-p62 Mitophagy Regulatory Loop as a Target for Preventive Therapy of Neurodegenerative Diseases.Brain Sci. 2020 Nov 12;10(11):847. doi: 10.3390/brainsci10110847. Brain Sci. 2020. PMID: 33198234 Free PMC article. Review.
-
Contribution of the Nrf2 Pathway on Oxidative Damage and Mitochondrial Failure in Parkinson and Alzheimer's Disease.Antioxidants (Basel). 2021 Jul 2;10(7):1069. doi: 10.3390/antiox10071069. Antioxidants (Basel). 2021. PMID: 34356302 Free PMC article. Review.
-
Losartan Mitigates Oxidative Stress in the Brains of Aged and Inflamed IL-10-/- Mice.J Gerontol A Biol Sci Med Sci. 2022 Sep 1;77(9):1784-1788. doi: 10.1093/gerona/glac101. J Gerontol A Biol Sci Med Sci. 2022. PMID: 35486382 Free PMC article.
-
p62: Friend or Foe? Evidences for OncoJanus and NeuroJanus Roles.Int J Mol Sci. 2020 Jul 16;21(14):5029. doi: 10.3390/ijms21145029. Int J Mol Sci. 2020. PMID: 32708719 Free PMC article. Review.
References
-
- Hara T, Nakamura K, Matsui M, et al. Suppression of basal autophagy in neural cells causes neurodegenerative disease in mice. Nature. 2006;441(7095):885–889. - PubMed
-
- Komatsu M, Waguri S, Koike M, et al. Homeostatic levels of p62 control cytoplasmic inclusion body formation in autophagy-deficient mice. Cell. 2007;131:1149–1163. - PubMed
LinkOut - more resources
Full Text Sources
Other Literature Sources
Research Materials