. 2014 Dec 16;107(12):2872-2880.
doi: 10.1016/j.bpj.2014.10.061.

The motility of axonemal dynein is regulated by the tubulin code

Affiliations

The motility of axonemal dynein is regulated by the tubulin code

Joshua D Alper et al. Biophys J. .

Abstract

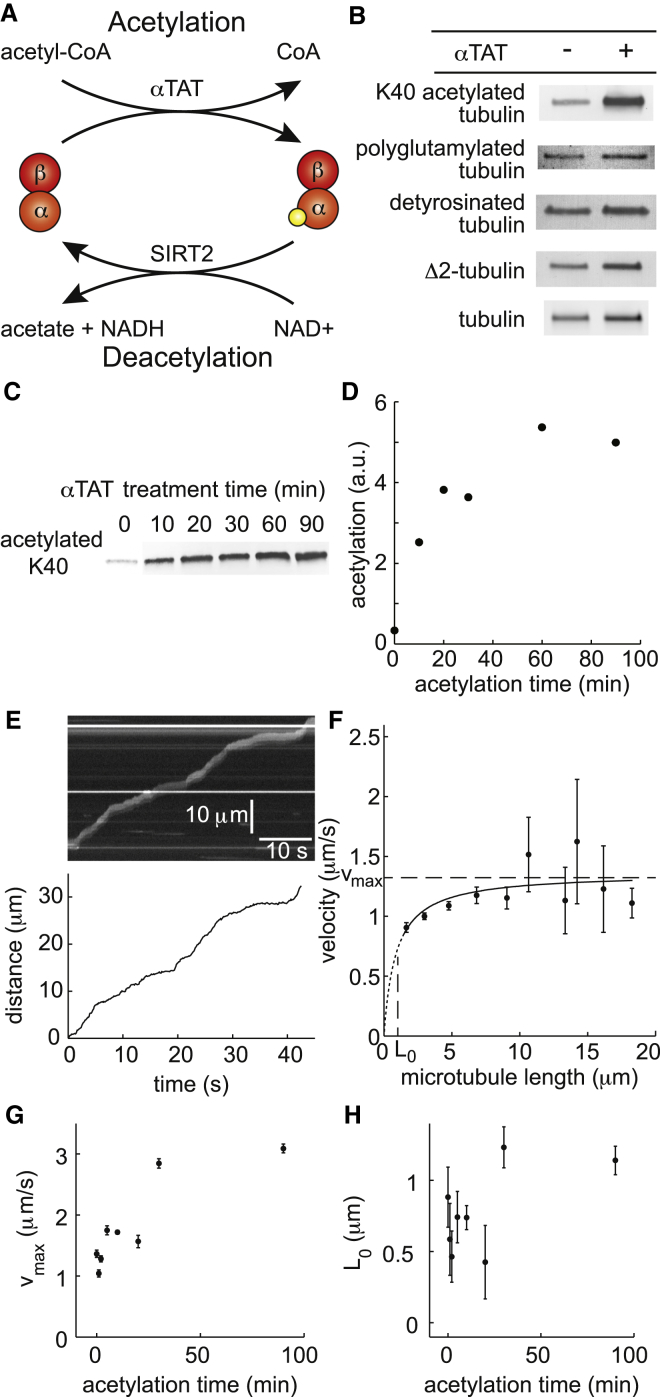
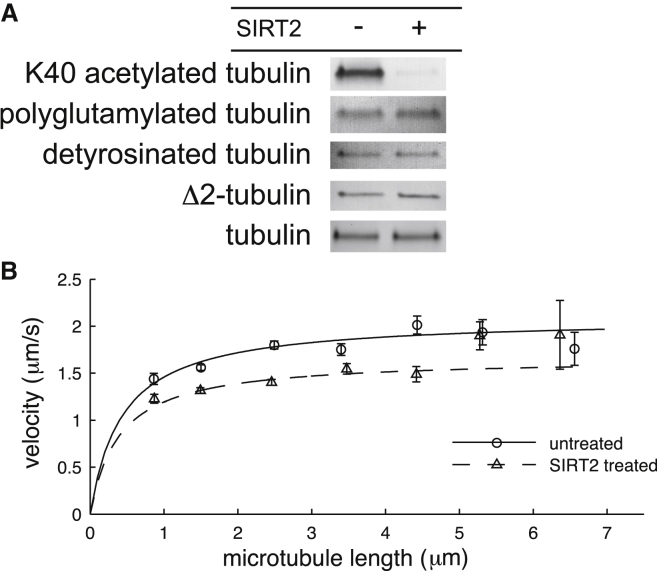
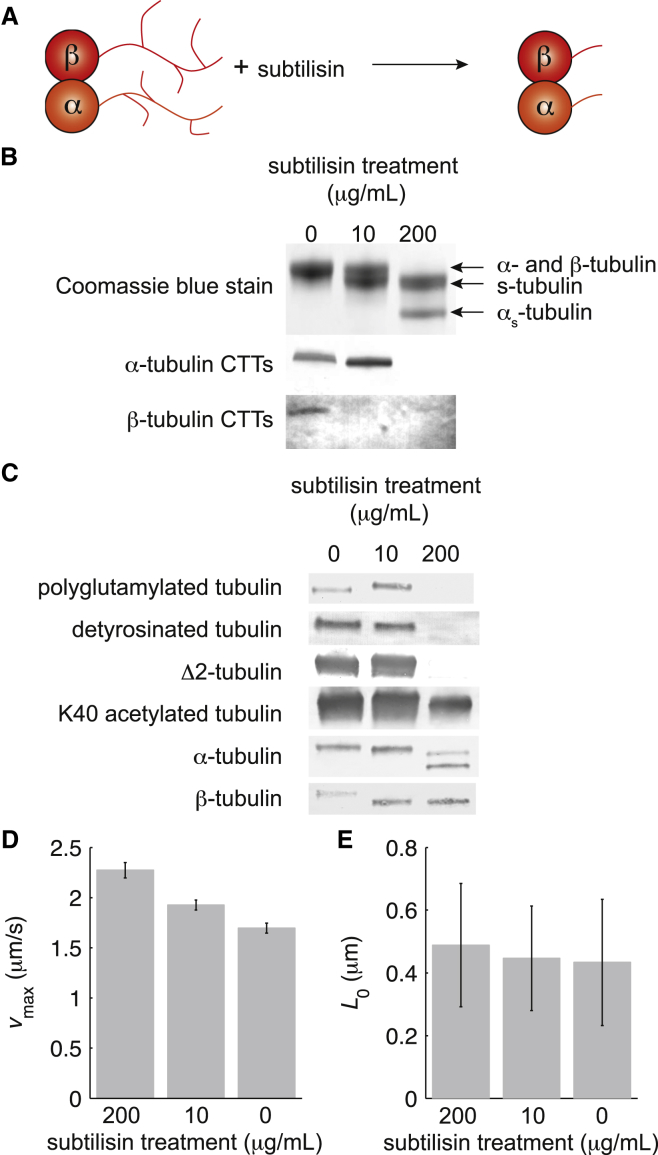
Microtubule diversity, arising from the utilization of different tubulin genes and from posttranslational modifications, regulates many cellular processes including cell division, neuronal differentiation and growth, and centriole assembly. In the case of cilia and flagella, multiple cell biological studies show that microtubule diversity is important for axonemal assembly and motility. However, it is not known whether microtubule diversity directly influences the activity of the axonemal dyneins, the motors that drive the beating of the axoneme, nor whether the effects on motility are indirect, perhaps through regulatory pathways upstream of the motors, such as the central pair, radial spokes, or dynein regulatory complex. To test whether microtubule diversity can directly regulate the activity of axonemal dyneins, we asked whether in vitro acetylation or deacetylation of lysine 40 (K40), a major posttranslational modification of α-tubulin, or whether proteolytic cleavage of the C-terminal tail (CTT) of α- and β-tubulin, the location of detyrosination, polyglutamylation, and polyglycylation modifications as well as most of the genetic diversity, can influence the activity of outer arm axonemal dynein in motility assays using purified proteins. By quantifying the motility with displacement-weighted velocity analysis and mathematically modeling the results, we found that K40 acetylation increases and CTTs decrease axonemal dynein motility. These results show that axonemal dynein directly deciphers the tubulin code, which has important implications for eukaryotic ciliary beat regulation.


Figures

Figure 1
Figure 1
Increasing acetylation increases axonemal dynein speed on porcine microtubules. (A) Schematic of tubulin acetylation and deacetylation by αTAT and SIRT2, respectively. The orange and red circles represent α- and β-tubulins, respectively. The yellow circle represents the acetylated form of K40. (B) Western blots of porcine microtubules treated with αTAT showing that αTAT treatment significantly increased the fraction of acetylated tubulin whereas the CTT-associated PTMs were unaffected. Tubulin loading was assayed by visualization in the gel using the TGX Stain-Free Precast Gel protocol before transfer to the nitrocellulose membrane. (C) Western blot of microtubules treated with αTAT showing that increased αTAT treatment time increases the fraction of acetylated tubulin. (D) Densitometry of the Western blot from panel C. (E) Example raw gliding assay data. (top) Typical kymograph of a microtubule (length = 2.6 μm) gliding on axonemal dynein that shows the characteristic unsteadiness of axonemal dynein gliding assays. (bottom) Plot of the microtubule’s distance traveled as a function of time. This is an example of typical gliding data after tracking. (F) Typical plot of mean microtubule gliding velocity as a function of microtubule length. This example is for the case of untreated microtubules. The data points were calculated by pooling microtubules in 2 μm bins and averaging their displacement-weighted mean velocities. The error bars are the standard error of the mean for each bin. The line is a least squares fit to Eq. 1 calculated before pooling and weighted by total distance traveled. This fit was used to calculate vmax and L0, shown with dashed lines, and it is typical of all cases. (G) The calculated vmax for each αTAT treatment condition plotted as a function of acetylation time. (H) The calculated L0 for each αTAT treatment condition plotted as a function of acetylation time. The data points for panels G and H were calculated by pooling the microtubule tracks from at least three movies per condition. A total of 213, 140, 280, 257, 1034, 94, 474, and 438 microtubules were analyzed for the αTAT treatment times of 0, 1, 2, 5, 10, 20, 30, and 90 min, respectively. The error bars in G and H are the standard errors for each parameter. To see this figure in color, go online.
Figure 2
Figure 2
Deacetylation decreased axonemal dynein speed on Chlamydomonas microtubules. (A) Western blots of Chlamydomonas microtubules treated with SIRT2 showing that ΣIPT2 treatment significantly decreased the fraction of acetylated tubulin whereas other CTT-associated PTMs were unaffected. Tubulin loading was assayed by visualization in the gel using the TGX Stain-Free Precast Gel protocol before transfer to the nitrocellulose membrane. (B) The mean velocity of SIRT2-treated (triangles) and untreated (circles) microtubules plotted as a function of microtubule length. The data points were calculated by pooling microtubules in 1 μm bins and averaging their displacement-weighted velocities. The error bars are the standard error of the mean for each microtubule bin. The lines, which are least-squares fits to Eq. 1 for the unpooled SIRT2-treated (dashed) and untreated (solid) microtubules, respectively, were calculated before pooling and weighted by total distance traveled.
Figure 3
Figure 3
CTT cleavage increases axonemal dynein speed on porcine microtubules. (A) Schematic of CTT cleavage by subtilisin. The orange and red circles represent α- and β-tubulins, respectively. The orange and red branched lines represent α- and β-tubulin CTTs with their CTT-related PTMs, respectively. (B) Gel electrophoresis of subtilisin-treated porcine microtubules stained with Coomassie brilliant blue. The bands are identified with arrows. α-tubulin and β-tubulin CTTs were visualized in these Western blots with CTT-specific antibodies. (C) Western blots of porcine microtubules treated with subtilisin showing that CTT-related posttranslational modifications were cleaved by treatment, whereas K40 acetylation remained in all treatments. α- and β-tubulins were visualized with antibodies that recognize epitopes not in their CTTs. (D) The calculated vmax for axonemal dynein on α- β-tubulin microtubules (0 μg/mL), α- βs-tubulin microtubules (10 μg/mL), and αs- βs-tubulin microtubules (200 μg/mL). (E) The calculated L0 for each subtilisin treatment. The data reported in both D and E were the fit parameters from a nonlinear least squares regression of 392, 711, and 712 microtubule tracks from subtilisin incubation concentrations of 200, 10, and 0 μg/mL, respectively. The error bars are the standard errors of the regression for each parameter. To see this figure in color, go online.

References

    1. Verhey K.J., Gaertig J. The tubulin code. Cell Cycle. 2007;6:2152–2160. - PubMed
    1. Ludueña R.F. Multiple forms of tubulin: different gene products and covalent modifications. Int. Rev. Cytol. 1998;178:207–275. - PubMed
    1. Garnham C.P., Roll-Mecak A. The chemical complexity of cellular microtubules: tubulin post-translational modification enzymes and their roles in tuning microtubule functions. Cytoskeleton. 2012;69:442–463. - PMC - PubMed
    1. Janke C., Bulinski J.C. Post-translational regulation of the microtubule cytoskeleton: mechanisms and functions. Nat. Rev. Mol. Cell Biol. 2011;12:773–786. - PubMed
    1. Dompierre J.P., Godin J.D., Saudou F. Histone deacetylase 6 inhibition compensates for the transport deficit in Huntington’s disease by increasing tubulin acetylation. J. Neurosci. 2007;27:3571–3583. - PMC - PubMed

Publication types

LinkOut - more resources