Comparative Study
. 2015 Feb 6;10(2):e0117064.
doi: 10.1371/journal.pone.0117064. eCollection 2015.

Extensive description and comparison of human supra-gingival microbiome in root caries and health

Affiliations
Comparative Study

Extensive description and comparison of human supra-gingival microbiome in root caries and health

Lin Chen et al. PLoS One. .

Abstract

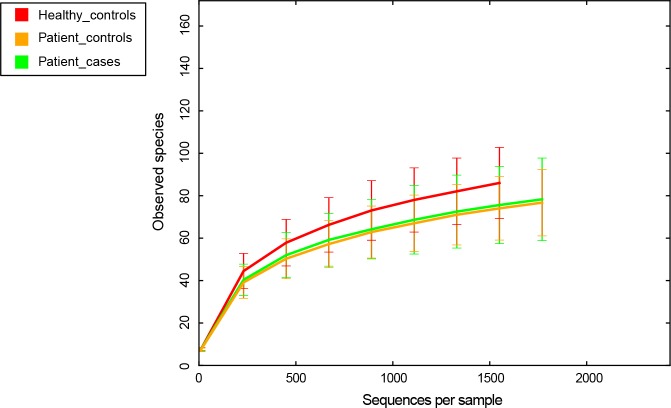
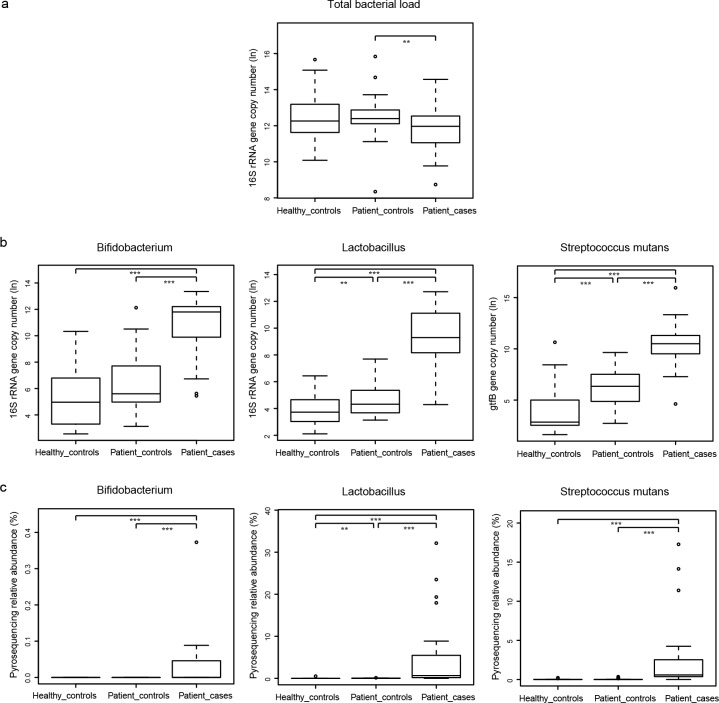
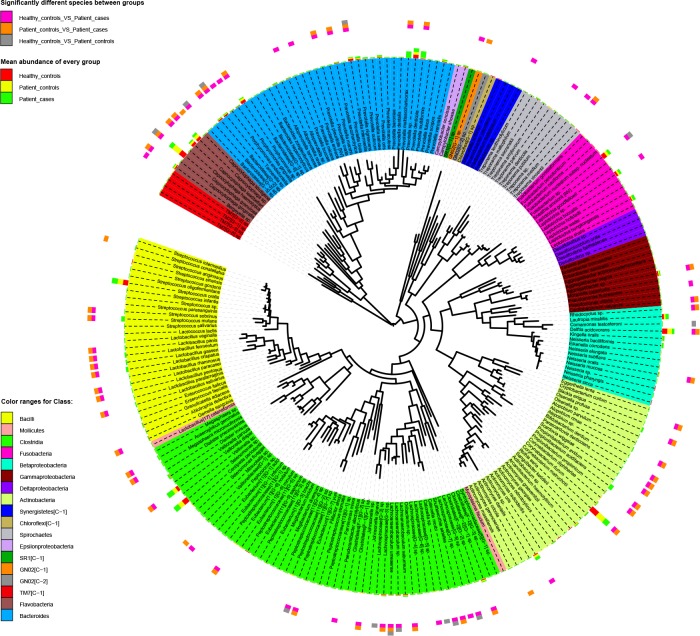
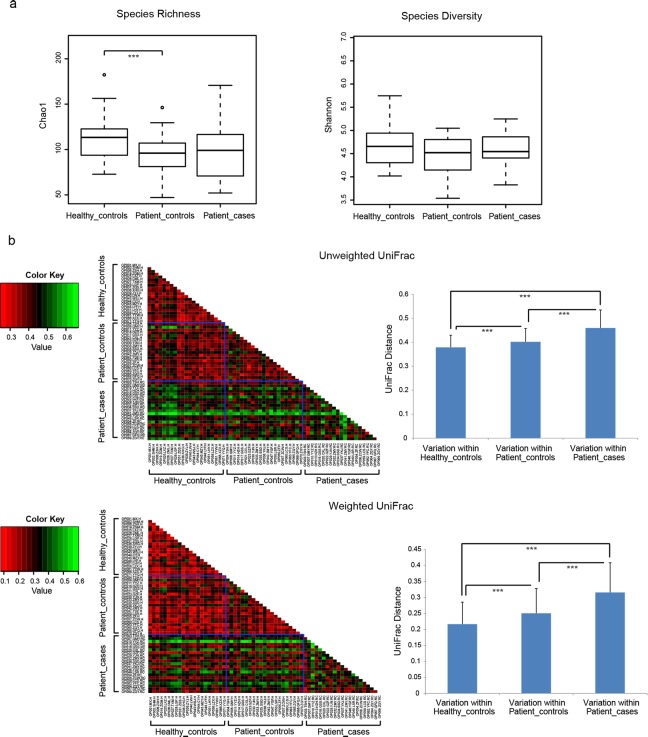
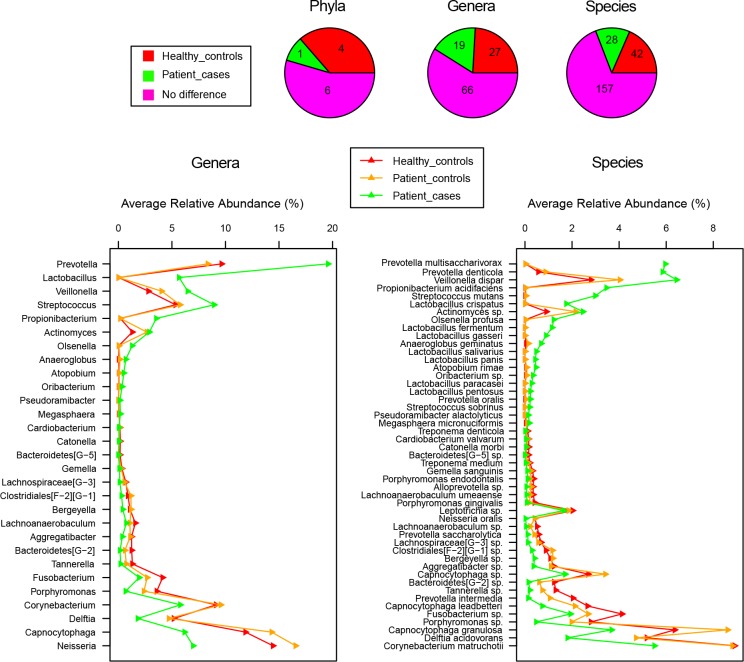
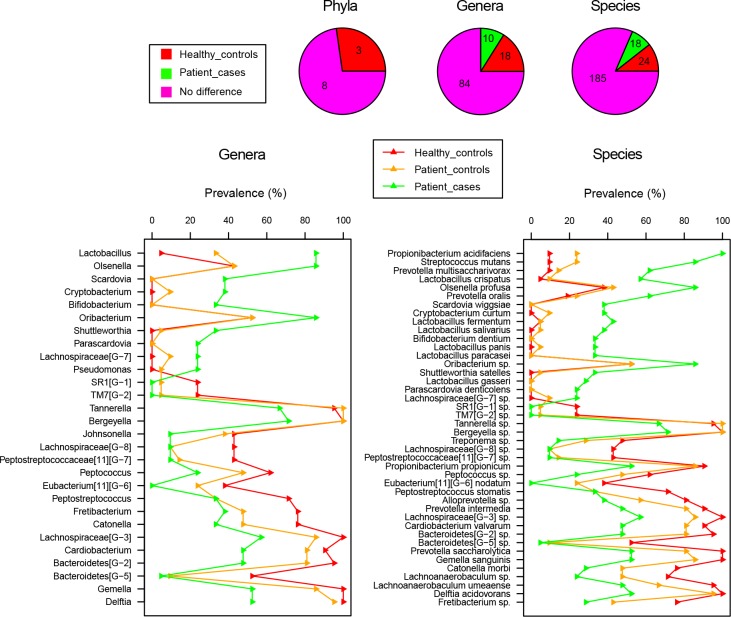
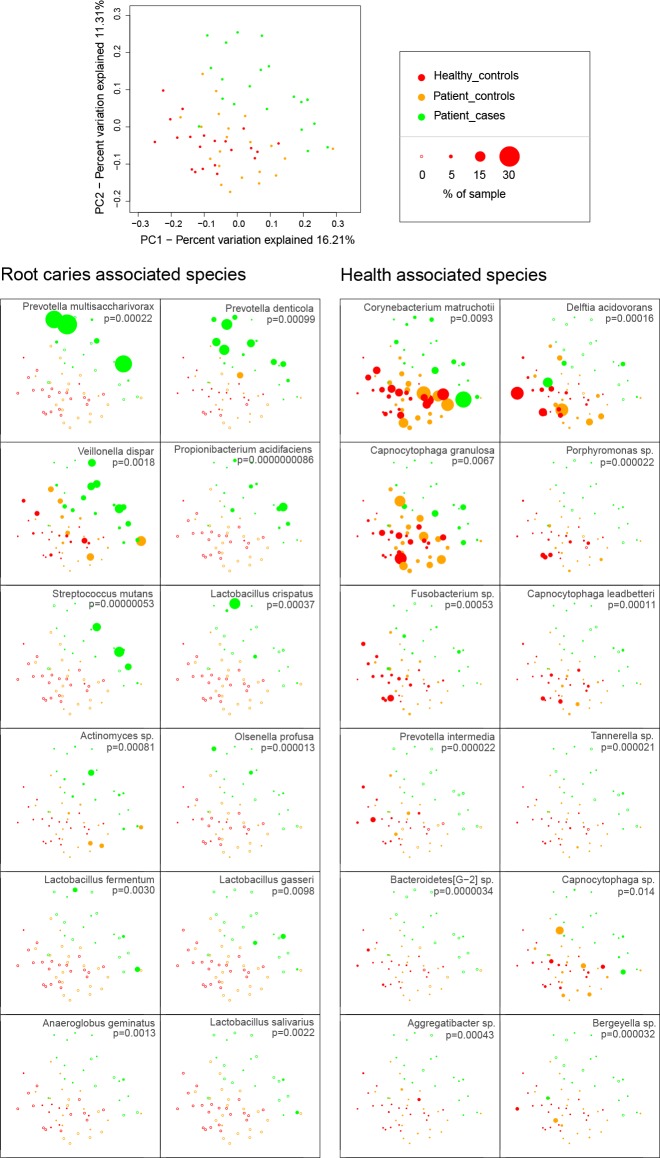
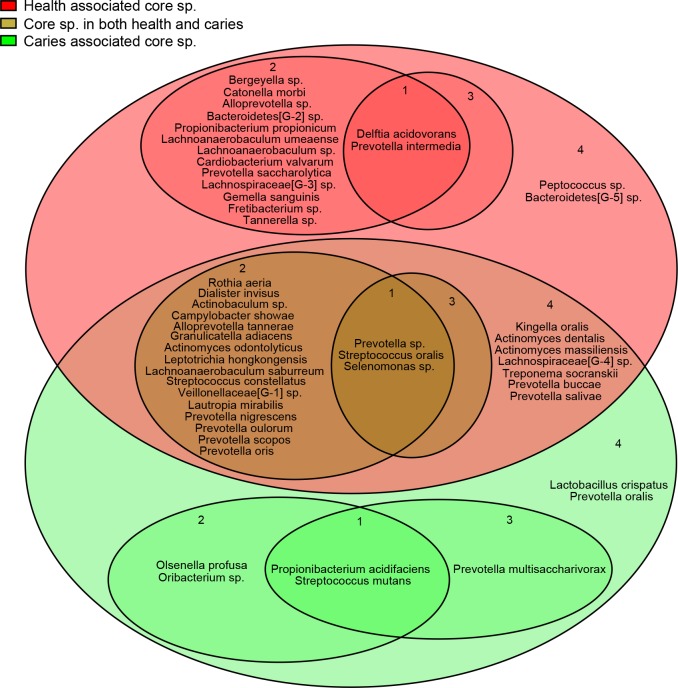
Knowledge of the polymicrobial etiology of root caries is limited. To conduct a comprehensive research study on root caries, we utilized 454-pyrosequencing of 16S rRNA gene libraries and quantitative PCR to compare supra-gingival bacterial communities from healthy sites and carious sites of 21 patients with root caries (Patient-controls and Patient-cases) and the sites of 21 healthy individuals (Healthy-controls) from two nursing homes. Healthy-controls and Patient-cases showed no significant differences in terms of biomass, species richness, and species diversity. However, as for beta diversity based on either community membership metric (unweighted UniFrac) or community structure metric (weighted UniFrac), Healthy-controls and Patient-cases were clearly distinguished from each other, appearing more variable in the community membership and structure in root caries microbiome but relatively conserved in the health microbiome. The Patient-controls group was at an intermediate stage between Healthy-controls and Patient-cases, but was more inclined to the former. Demonstrated in both relative abundance and prevalence of species in health and root caries, Propionibacterium acidifaciens, Streptococcus mutans, Olsenella profusa, Prevotella multisaccharivorax, and Lactobacillus crispatus were found to be most associated with root caries, whereas Delftia acidovorans, Bacteroidetes[G-2] sp., Lachnospiraceae[G-3] sp., and Prevotella intermedia are most associated with health. Our study provides a basis for further elucidating the microbial etiology of root caries in the elderly.


Conflict of interest statement

Competing Interests: The authors have declared that no competing interests exist.

Figures

Fig 1
Fig 1. Rarefaction curves for evaluation of species coverage in our study.
The x axis indicates the number of sequences per sample. The y axis indicates the average number of OTUs (0.03 distance threshold) per sample in each group. The error bars represent standard deviation.
Fig 2
Fig 2. Boxplots for comparison of bacterial loads by qPCR and bacterial relative abundances by 454 pyrosequencing.
(a) Boxplot for total bacterial load. (b) Boxplots for the total loads of genera Bifidobacterium, Lactobacillus, and species Streptococcus mutans. (c) Boxplots for the pyrosequencing relative abundances of the same taxa as (b). Gene copy number shown above was transformed by natural logarithm (ln) and relative abundance was transformed by percent (%). * denotes P < 0.1; ** denotes P < 0.05; *** denotes P < 0.01.
Fig 3
Fig 3. Maximum likelihood phylogenetic tree at the species level.
Inner loop displays species with color ranges for the class level (see color key at the bottom left); middle loop indicates mean relative abundance in each group (see color key at the top left); outer loop indicates significantly different species detected between groups (see color key at the top left). An online tool of iTOL was used to construct this tree.
Fig 4
Fig 4. Alpha diversity and beta diversity.
(a) Boxplots for alpha diversity metrics of Chao1 (species richness) and Shannon Diversity Index (species diversity). (b) Beta diversity metrics of unweighted UniFrac (community membership) and weighted UniFrac (community structure). The color in the heatmaps indicates the UniFrac distance between each pair of samples (see color key at the left). * denotes P < 0.1; ** denotes P < 0.05; *** denotes P < 0.01.
Fig 5
Fig 5. Distributions of abundance-based significant phyla, genera and species between health and root caries.
Pie charts display the counts distribution of significantly different taxa. Line charts sort significantly different genera and species in the order of magnitude of abundance change (≥0.1%) between Healthy_controls and Patient_cases.
Fig 6
Fig 6. Distributions of prevalence-based significant phyla, genera and species between health and root caries.
Pie charts display the counts distribution of significantly different taxa. Line charts sort significantly different genera and species in the order of magnitude of prevalence change between Healthy_controls and Patient_cases.
Fig 7
Fig 7. Samples clustering by PCoA.
All PCoA plots were first constructed on the basis of unweighted UniFrac distance (see the panel at the top left). Then the points in PCoA plots were weighted by the relative abundances of the top 12 root caries-associated species and top 12 health-associated species of Fig. 5.
Fig 8
Fig 8. Core supra-gingival microbiome in root caries and health.
Red field represents health-associated core species with significantly higher prevalence and relative abundance in Healthy_controls than in Patient_cases; green field represents root caries-associated core species with significantly higher prevalence and relative abundance in Patient_cases than in Healthy_controls; brown field represents core species in both health and root caries with no significantly different prevalence and relative abundance between the two groups. In each field, the prevalences of species were at least 1/2. Inner circles labeled 1 contain the species with high prevalence (prevalence ≥ 2/3) and high abundance (average relative abundance ≥ 2%); circles labeled 2 contain species with high prevalence (prevalence ≥ 2/3) but low abundance (average relative abundance < 2%); circles labeled 3 contain species with moderate prevalence (1/2 ≤ prevalence < 2/3) but high abundance (average relative abundance ≥ 2%); circles labeled 4 contain species with moderate prevalence (1/2 ≤ prevalence < 2/3) and low abundance (average relative abundance < 2%).

References

    1. Du M, Jiang H, Tai B, Zhou Y, Wu B, et al. (2009) Root caries patterns and risk factors of middle-aged and elderly people in China. Community Dent Oral Epidemiol 37: 260–266. 10.1111/j.1600-0528.2009.00461.x - DOI - PubMed
    1. Preza D, Olsen I, Aas JA, Willumsen T, Grinde B, et al. (2008) Bacterial profiles of root caries in elderly patients. J Clin Microbiol 46: 2015–2021. 10.1128/JCM.02411-07 - DOI - PMC - PubMed
    1. Marsh PD, Martin MV (2009) Oral Microbiology Text and Evolve eBooks Package, 5th edition London, United Kingdom: Elsevier Health Sciences;
    1. Ellen RP, Banting DW, Fillery ED (1985) Longitudinal microbiological investigation of a hospitalized population of older adults with a high root surface caries risk. J Dent Res 64: 1377–1381. - PubMed
    1. Papone Yorio V (1989) Actinomyces. Its relation to dental plaque—root caries—actinomycosis. Odontoestomatologia 2: 47–53. - PubMed

Publication types

Substances

Associated data

LinkOut - more resources