. 2015 Feb 6;10(2):e0116644.
doi: 10.1371/journal.pone.0116644. eCollection 2015.

Glioma-associated microglia/macrophages display an expression profile different from M1 and M2 polarization and highly express Gpnmb and Spp1

Affiliations

Glioma-associated microglia/macrophages display an expression profile different from M1 and M2 polarization and highly express Gpnmb and Spp1

Frank Szulzewsky et al. PLoS One. .

Abstract

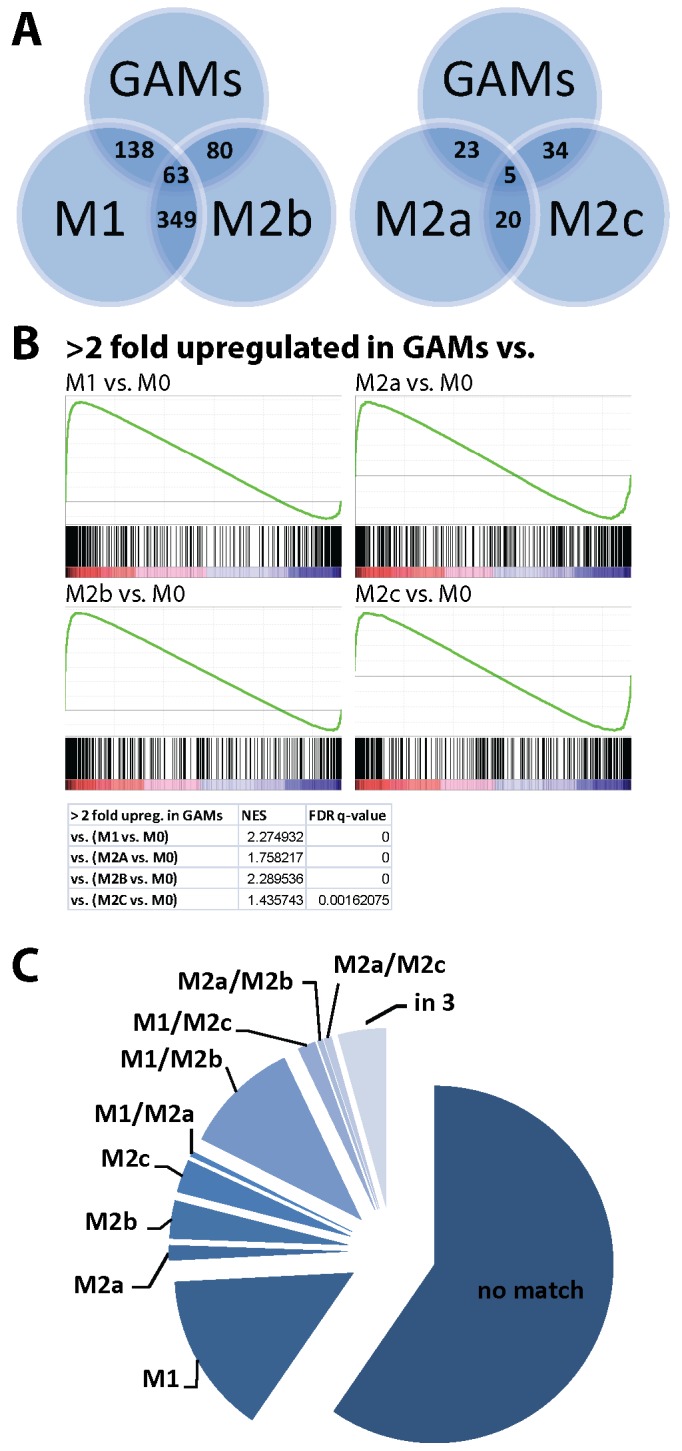
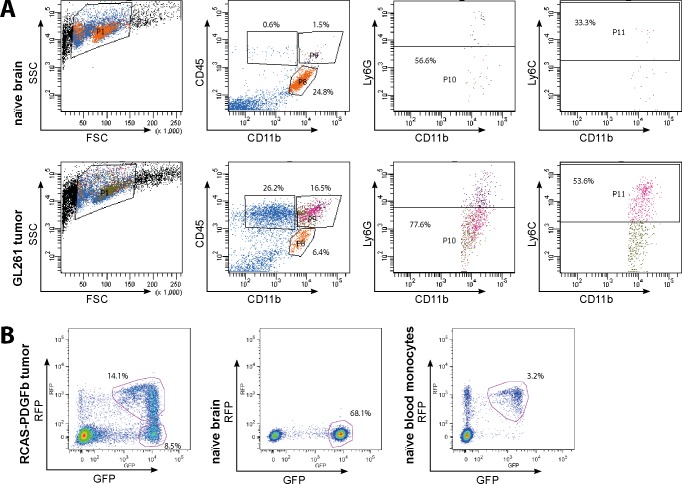
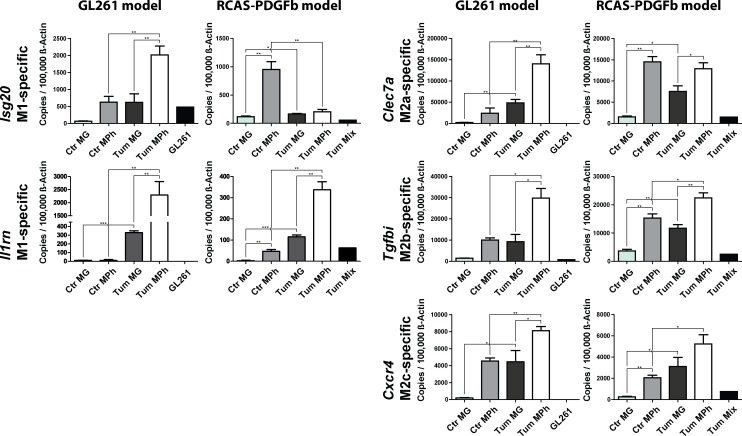
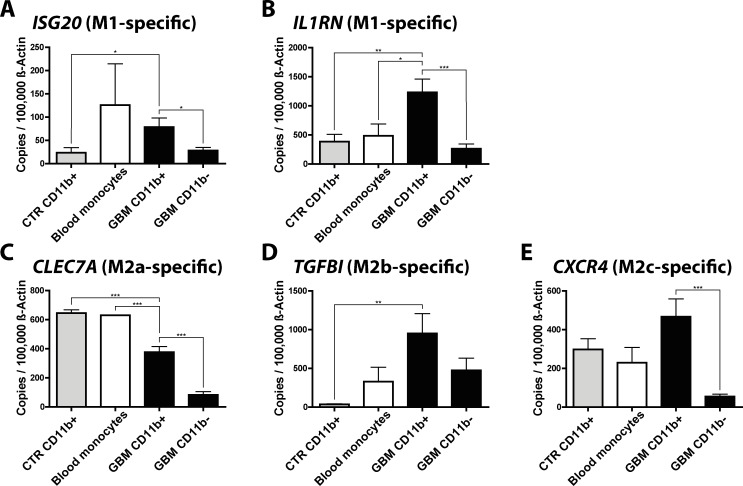
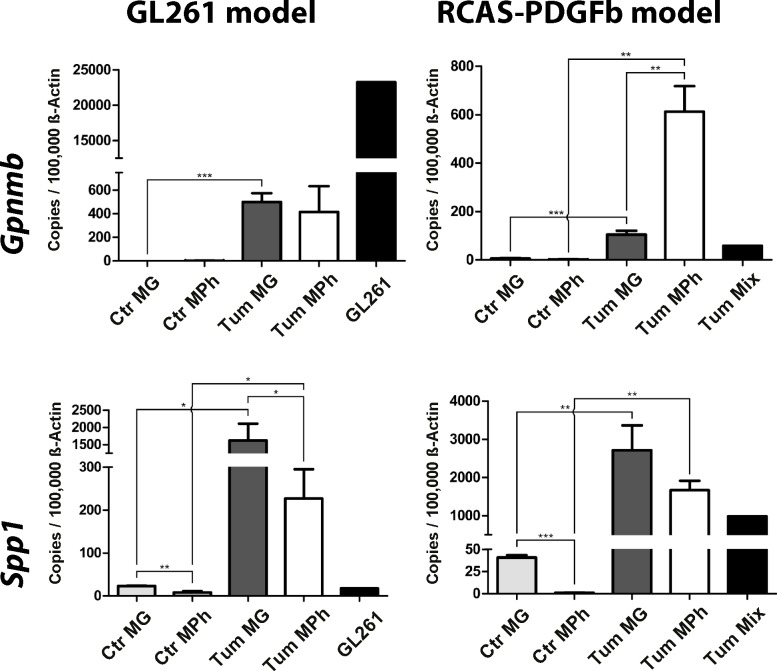
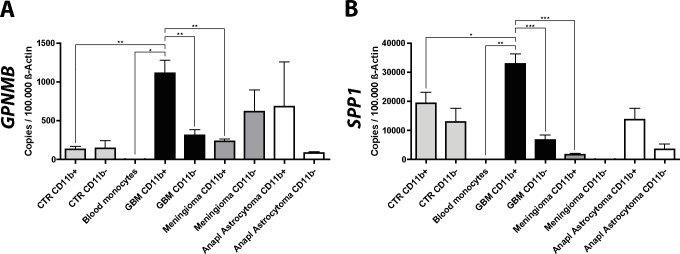
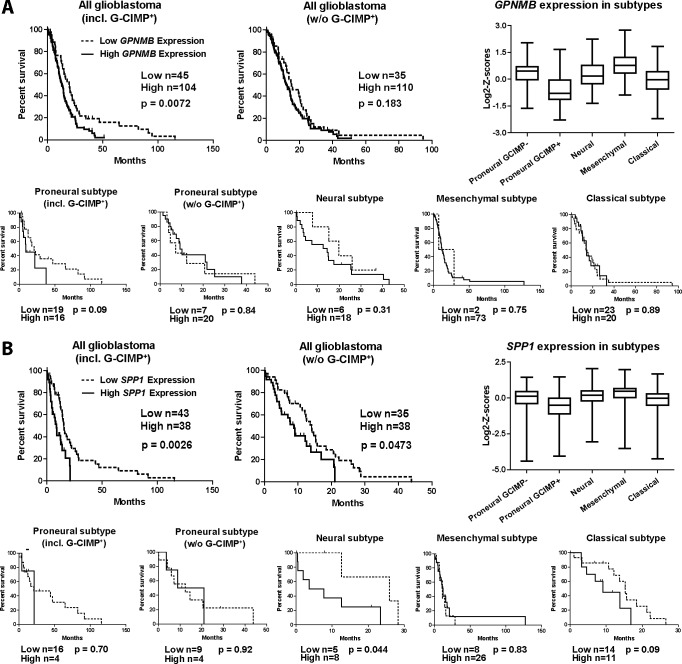
Malignant glioma belong to the most aggressive neoplasms in humans with no successful treatment available. Patients suffering from glioblastoma multiforme (GBM), the highest-grade glioma, have an average survival time of only around one year after diagnosis. Both microglia and peripheral macrophages/monocytes accumulate within and around glioma, but fail to exert effective anti-tumor activity and even support tumor growth. Here we use microarray analysis to compare the expression profiles of glioma-associated microglia/macrophages and naive control cells. Samples were generated from CD11b+ MACS-isolated cells from naïve and GL261-implanted C57BL/6 mouse brains. Around 1000 genes were more than 2-fold up- or downregulated in glioma-associated microglia/macrophages when compared to control cells. A comparison with published data sets of M1, M2a,b,c-polarized macrophages revealed a gene expression pattern that has only partial overlap with any of the M1 or M2 gene expression patterns. Samples for the qRT-PCR validation of selected M1 and M2a,b,c-specific genes were generated from two different glioma mouse models and isolated by flow cytometry to distinguish between resident microglia and invading macrophages. We confirmed in both models the unique glioma-associated microglia/macrophage phenotype including a mixture of M1 and M2a,b,c-specific genes. To validate the expression of these genes in human we MACS-isolated CD11b+ microglia/macrophages from GBM, lower grade brain tumors and control specimens. Apart from the M1/M2 gene analysis, we demonstrate that the expression of Gpnmb and Spp1 is highly upregulated in both murine and human glioma-associated microglia/macrophages. High expression of these genes has been associated with poor prognosis in human GBM, as indicated by patient survival data linked to gene expression data. We also show that microglia/macrophages are the predominant source of these transcripts in murine and human GBM. Our findings provide new potential targets for future anti-glioma therapy.


Conflict of interest statement

Competing Interests: The authors have declared that no competing interests exist.

Figures

Fig 1
Fig 1. Graphical representation of gene expression patterns in the four data sets.
The four GEDI maps show that the gene expression patterns of GAMs and naive microglia are more similar to each other than both macrophage datasets (blue colour indicating low and red colour high mRNA expression levels). The white circle highlights a central cluster of highly expressed genes in GAMs that is different from naive microglia. GAMs: glioma-associated microglia/macrophage microarray data; MG: naive microglia microarray data; Mac1: external data set from Keller, Mazuch et al. 2009; Mac2: external data set from Young, Eksmond et al. 2012.
Fig 2
Fig 2. WGCNA gene clustering reveals glioma-regulated gene modules.
Each color represents a different module and each module contains genes with similar expression patterns over all four sample sets. The glioma-regulated modules (labeled as red and brown) were further analyzed, as they contained genes that were upregulated in the glioma-associated set when compared to all three control sets. A third module (labeled as green module) contained genes that were highly expressed in GAMs when compared to naïve microglia, but were already highly expressed in peripheral macrophages. The module that is depicted as orange contains genes that were highly expressed in GAMs, and also highly expressed in naïve microglia, however expressed at lower levels in peripheral macrophages. All other clusters contained genes that did not seem to be glioma-regulated.
Fig 3
Fig 3. Comparison of GAMs with data sets of M1, M2a,b,c-stimulated macrophages.
We retrieved data sets from http://www.ebi.ac.uk/arrayexpress (Data set: E-GEOD-32690; [44]), containing data of macrophages that were stimulated for 24 h in vitro into different polarization states (M0 (unstimulated), M1 (IFNγ + LPS), M2a (IL4), M2b (IFNγ + complexed Ig), and M2c (Dexamethasone)) and compared which genes in these data sets significantly overlapped with glioma-regulated genes in our GAMs data set. A: A graphical representation of the overlap of upregulated genes in GAMs and the four macrophage data sets. The GAMs gene expression profile shows the greatest number of overlaps with M1, and M2b polarized macrophages. B: Using Gene Set Enrichment Analysis (GSEA) we found that the 438 upregulated genes in GAMs are significantly enriched in the upregulated genes of all four macrophage polarization sets. C: Only a minority of genes upregulated in GAMs were also induced in the M1 to M2c phenotype, 59.5% of the genes that were upregulated in GAMs were not regulated in any of the four macrophage phenotypes.
Fig 4
Fig 4. Flow cytometry isolation strategies for generation of mouse qPCR samples.
A) Plots depicting the strategy for isolation of microglia and macrophages from naïve brains and GL261 glioma-bearing brains using antibody staining for CD11b, CD45, Ly6C, and Ly6G. CD45 staining was used to distinguish between CD11b+/CD45low resident microglia (gate P9) and CD11b+/CD45high/Ly6G-/Ly6Chigh invading macrophages/monocytes (gates P8, P10, and P11), which were mostly absent in naïve brain samples. B) GAMs from RCAS-PDGFb tumors were isolated relying on an antibody-independent approach. Primary tumors from Ntv-a/Ink4a-Arf-/- mice were reimplanted into Cx3cr1 GFP/wt Ccr2 RFP/wt mice and GAMS were sorted according to GFP and RFP expression. In naïve Cx3cr1 GFP/wt Ccr2 RFP/wt mice only GFP+ cells were present in the brain. In tumor-bearing mice, resident microglia were GFP+, whereas invading macrophages/monocytes were RFP+/GFPlow or GFP+/RFP+. RFP+/GFPlow naïve blood monocytes were used as peripheral controls.
Fig 5
Fig 5. qPCR validation of selected M1 and M2a,b,c-specific genes in murine GAMs.
We selected 5 genes that were upregulated in GAMs and specific for either M1 (Il1rn and Isg20), M2a (Clec7a), M2b (Tgfbi), or M2c polarization (Cxcr4) and investigated the expression of these using qRT-PCR. For this we isolated GAMs from GL261 and RCAS-PDGFb tumors using flow cytometry, in order to distinguish between resident microglia and invading macrophages/monocytes and used microglia, and spleen-derived macrophages/monocytes from naïve mice as controls. CTR MG: naïve microglia, CTR Mph: naïve monocytes, Tum MG: glioma-associated microglia, Tum Mph: glioma-associated macrophages/monocytes, GL261: cultured GL261 cells, Tum Mix: cultured RCAS-PDGFb tumor cells. Bar graphs illustrate the absolute number of transcripts normalized to 100,000 transcripts of Actb (n = 4). Analysis was done by students t test. Error bars indicate the Standard Error of Mean (SEM). *, p<0.05; **, p<0.01; ***, p<0.001
Fig 6
Fig 6. qPCR validation of selected M1 and M2a,b,c-specific genes in human GAMs.
We determined the expression of the M1 (IL1RN and ISG20), M2a (CLEC7A), M2b (TGFBI), and M2c-specific (CXCR4) genes in CD11b+ and CD11b- cells isolated from human GBM (CD11b+ n = 13, CD11b- n = 5), control brain (CD11b+ n = 5, CD11b- n = 2) and blood monocyte samples (n = 2). Bar graphs illustrate the absolute number of transcripts normalized to 100,000 transcripts of ACTB. Analysis was done by students t test. Error bars indicate the SEM. *, p<0.05; **, p<0.01; ***, p<0.001
Fig 7
Fig 7. Gpnmb and Spp1 expression is upregulated in murine GAMs.
The gene expression of Gpnmb and Spp1 was validated using qRT-PCR. For this we used the same FACS-sorted samples from GL261 and RCAS tumors as in Fig. 5. The upregulation of both genes could be confirmed in both tumor models. Resident microglia and invading macrophages/monocytes show different expression patterns of these genes. CTR MG: naïve microglia, CTR Mph: naïve monocytes, Tum MG: glioma-associated microglia, Tum Mph: glioma-associated macrophages/monocytes, GL261: cultured GL261 cells, Tum Mix: cultured RCAS-PDGFb tumor cells. Bar graphs illustrate the absolute number of transcripts normalized to 100,000 transcripts of Actb (n = 4). Analysis was done by students t test. Error bars indicate the Standard Error of Mean (SEM). *, p<0.05; **, p<0.01; ***, p<0.001
Fig 8
Fig 8. GPNMB and SPP1 expression is upregulated in human GAMs.
We determined the expression of the genes GPNMB and SPP1 in CD11b+ and CD11b- cells isolated from human GBM (CD11b+ n = 15, CD11b- n = 9), meningioma (CD11b+ n = 5, CD11b- n = 3), grade III anaplastic astrocytoma (CD11b+ n = 2, CD11b- n = 2), control brain (CD11b+ n = 5, CD11b- n = 2) and blood monocyte samples (n = 2). The expression of GPNMB and SPP1 was significantly higher in CD11b+ cells isolated from GBMs compared to CD11b+ cells isolated from control brain, benign meningioma samples, blood monocytes, and CD11b- cells in GBM. Bar graphs illustrate the absolute number of transcripts normalized to 100,000 transcripts of ACTB. Analysis was done by students t test. Error bars indicate the SEM. *, p<0.05; **, p<0.01; ***, p<0.001
Fig 9
Fig 9. High GPNMB and SPP1 expression is associated with worsened survival prognosis in human GBM patients.
Data taken from the TCGA database, showing survival probability of glioma patients grouped according to high and low expression of our target genes GPNMB (A) and SPP1 (B). High expression of both genes has a negative effect on patient prognosis. Patients were in addition grouped into the four molecular subtypes (proneural, neural, mesenchymal, and classical). Low GPNMB expression seems to have the most severe effect on patient prognosis in the proneural subtype when including G-CIMP+ tumors, but no significant effect in the other subtypes. Low SPP1 expression seems to have the highest effect on patient prognosis in the neural and classical subtypes. Furthermore, both genes are differently regulated in the four subtypes (box plots in A and B) Significances for box plots: GPNMB: proneural GCIMP- (PG-) vs. proneural GCIMP+ (PG+) ***, PG- vs. mesenchymal (M) *** PG- vs. classical (C) **, PG+ vs. neural (N) ***, PG+ vs. M ***, PG+ vs. C **, N vs. M ***, N vs. C *, M vs. C ***. SPP1: PG- vs. M ***, PG+ vs. N ***, PG+ vs. M ***, C vs. M ***.*, p<0.05; **, p<0.01; ***, p<0.001

Similar articles

Cited by

References

    1. Wen PY, Kesari S (2008) Malignant gliomas in adults. The New England journal of medicine 359: 492–507. 10.1056/NEJMra0708126 - DOI - PubMed
    1. Brennan C, Momota H, Hambardzumyan D, Ozawa T, Tandon A, et al. (2009) Glioblastoma subclasses can be defined by activity among signal transduction pathways and associated genomic alterations. PloS one 4: e7752 10.1371/journal.pone.0007752 - DOI - PMC - PubMed
    1. Phillips HS, Kharbanda S, Chen R, Forrest WF, Soriano RH, et al. (2006) Molecular subclasses of high-grade glioma predict prognosis, delineate a pattern of disease progression, and resemble stages in neurogenesis. Cancer cell 9: 157–173. - PubMed
    1. Sottoriva A, Spiteri I, Piccirillo SG, Touloumis A, Collins VP, et al. (2013) Intratumor heterogeneity in human glioblastoma reflects cancer evolutionary dynamics. Proceedings of the National Academy of Sciences of the United States of America 110: 4009–4014. 10.1073/pnas.1219747110 - DOI - PMC - PubMed
    1. Patel AP, Tirosh I, Trombetta JJ, Shalek AK, Gillespie SM, et al. (2014) Single-cell RNA-seq highlights intratumoral heterogeneity in primary glioblastoma. Science. - PMC - PubMed

Publication types

MeSH terms