. 2015 Jun;22(6):595-608.
doi: 10.1089/cmb.2014.0158. Epub 2015 Feb 6.

Data Imputation in Epistatic MAPs by Network-Guided Matrix Completion

Affiliations

Data Imputation in Epistatic MAPs by Network-Guided Matrix Completion

Marinka Žitnik et al. J Comput Biol. 2015 Jun.

Abstract

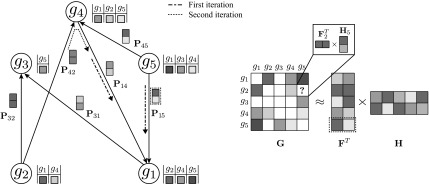
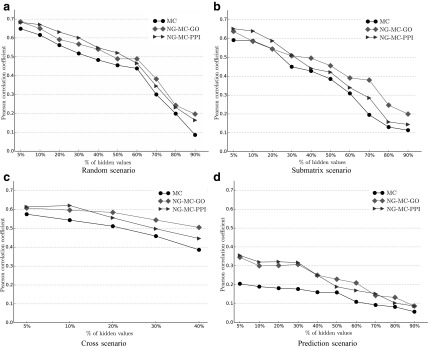
Epistatic miniarray profile (E-MAP) is a popular large-scale genetic interaction discovery platform. E-MAPs benefit from quantitative output, which makes it possible to detect subtle interactions with greater precision. However, due to the limits of biotechnology, E-MAP studies fail to measure genetic interactions for up to 40% of gene pairs in an assay. Missing measurements can be recovered by computational techniques for data imputation, in this way completing the interaction profiles and enabling downstream analysis algorithms that could otherwise be sensitive to missing data values. We introduce a new interaction data imputation method called network-guided matrix completion (NG-MC). The core part of NG-MC is low-rank probabilistic matrix completion that incorporates prior knowledge presented as a collection of gene networks. NG-MC assumes that interactions are transitive, such that latent gene interaction profiles inferred by NG-MC depend on the profiles of their direct neighbors in gene networks. As the NG-MC inference algorithm progresses, it propagates latent interaction profiles through each of the networks and updates gene network weights toward improved prediction. In a study with four different E-MAP data assays and considered protein-protein interaction and gene ontology similarity networks, NG-MC significantly surpassed existing alternative techniques. Inclusion of information from gene networks also allowed NG-MC to predict interactions for genes that were not included in original E-MAP assays, a task that could not be considered by current imputation approaches.

Keywords: data integration; epistatic miniarray profile; gene network; genetic interaction; matrix completion; missing value imputation.


Figures

<b>FIG. 1.</b>
FIG. 1.
A toy application of the network-guided matrix completion (NG-MC) algorithm. A hypothetical E-MAP data set with five genes is given, formula image. Prior knowledge is presented through one gene network P (formula image). Gene interaction profiles are listed next to corresponding nodes in gene network P (left) and are shown in the sparse and symmetric matrix G (right). Different shades of gray quantify interaction strength while white elements in G denote missing values. Matrices F and H are gene latent feature matrices. Gene latent feature vector Fgi depends on each iteration of the NG-MC on the latent feature vectors of gi's direct neighbors in P. For instance, the latent vector of gene g1 in F depends on the first iteration of the NG-MC algorithm on latent vectors of its neighbors g4 and g5 (Fg4 and Fg5 are shown on input edges of g1) whose degrees of influence are determined by P14 and P15, respectively. In the second iteration, the update of Fg1 depends also on the latent vector of g1's 2-hop neighbor, g2, hence the influence of gene latent feature vectors propagates through P. Gene latent feature matrix H is not influenced by gene neighborhoods in P.
<b>FIG. 2.</b>
FIG. 2.
Impact of different values for latent dimensionality (a) and regularization parameters (b) on the imputation performance of network-guided matrix completion. Experiments that varied latent dimensionality set the regularization parameters to λF = 0.01 and formula image. When investigating the influence of regularization the latent dimensionality was set to k = 60 and the remaining regularization parameter to 0.01. Results of sensitivity to parameter selection is reported for the early secretory pathway data set and network derived from gene ontology annotations. Similar behavior was observed with other E-MAP data sets.
<b>FIG. 3.</b>
FIG. 3.
The four configurations producing missing values in E-MAP data. Random configuration has hidden a subset of genetic interactions selected uniformly at random. Submatrix and cross configurations have hidden all interactions within a random subset of genes or between two random disjoint subsets of genes, respectively. In the prediction scenario, complete genetic interaction profiles of a gene subset are removed.
<b>FIG. 4.</b>
FIG. 4.
Performance of imputation methods (Pearson correlation coefficient) proposed in this article for different missing data rates and missing value configurations. Refer to the main text and Figure 3 for description of the missing value scenarios. MC denotes matrix completion approach (sec. 3.2). Network-guided matrix completion (sec. 3.3) is represented by NG-MC-GO and NG-MC-PPI. Performance was assessed for the early secretory pathway E-MAP data set, because it contains the least missing values. The cross configuration is not applicable when more than 50% of the values are missing.
<b>FIG. 5.</b>
FIG. 5.
Imputation performance of network-guided matrix completion (NG-MC) for different fractions and distributions of missing values in the lipid E-MAP data set and for various sources of biological network information. Prior knowledge is included in the form of protein–protein interaction network (PPI), a network derived from gene ontology annotation data (GO) and collective consideration of both PPI and GO. Refer to Figure 3 for description of random and cross missing value configurations.

Similar articles

Cited by

References

    1. Ashburner M., Ball C.A., Blake J.A., et al. . 2000. Gene Ontology: tool for the unification of biology. Nat. Genet. 25, 25–29 - PMC - PubMed
    1. Bandyopadhyay S., Kelley R., Krogan N.J., et al. . 2008. Functional maps of protein complexes from quantitative genetic interaction data. PLoS Comput. Biol. 4, e1000065 - PMC - PubMed
    1. Bø T.H., Dysvik B., and Jonassen I. 2004. LSimpute: accurate estimation of missing values in microarray data with least squares methods. Nucleic Acids Res. 32, e34. - PMC - PubMed
    1. Brock G.N., Shaffer J.R., Blakesley R.E., et al. . 2008. Which missing value imputation method to use in expression profiles: a comparative study and two selection schemes. BMC Bioinformatics 9, 12. - PMC - PubMed
    1. Cai J.-F., Candès E.J., and Shen Z. 2010. A singular value thresholding algorithm for matrix completion. SIAM J. Optimiz. 20, 1956–1982

Publication types

MeSH terms

LinkOut - more resources