. 2015 Feb 6;11(2):e1004598.
doi: 10.1371/journal.ppat.1004598. eCollection 2015 Feb.

In vivo approaches reveal a key role for DCs in CD4+ T cell activation and parasite clearance during the acute phase of experimental blood-stage malaria

Affiliations

In vivo approaches reveal a key role for DCs in CD4+ T cell activation and parasite clearance during the acute phase of experimental blood-stage malaria

Henrique Borges da Silva et al. PLoS Pathog. .

Abstract

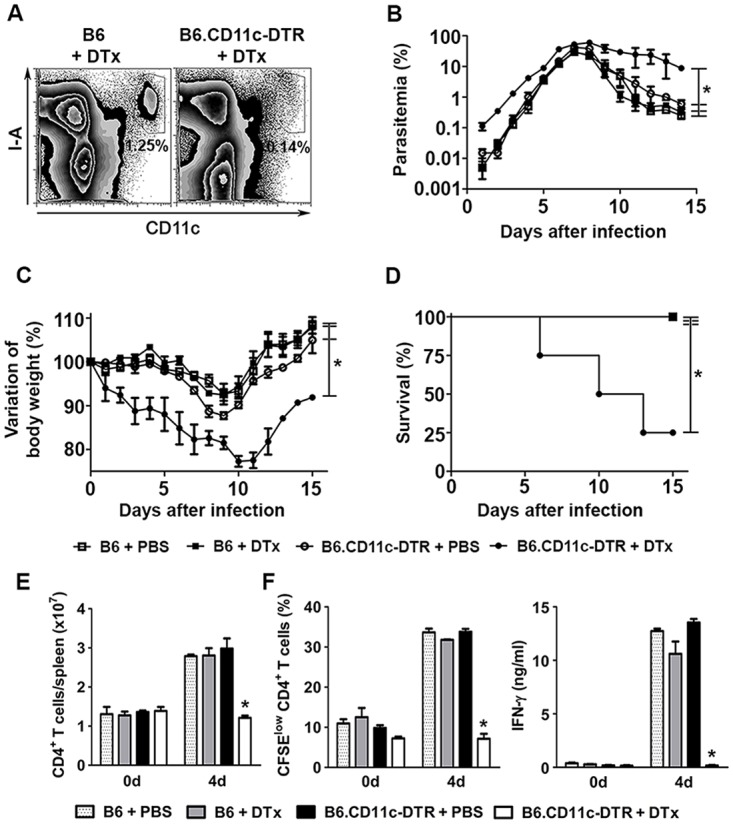
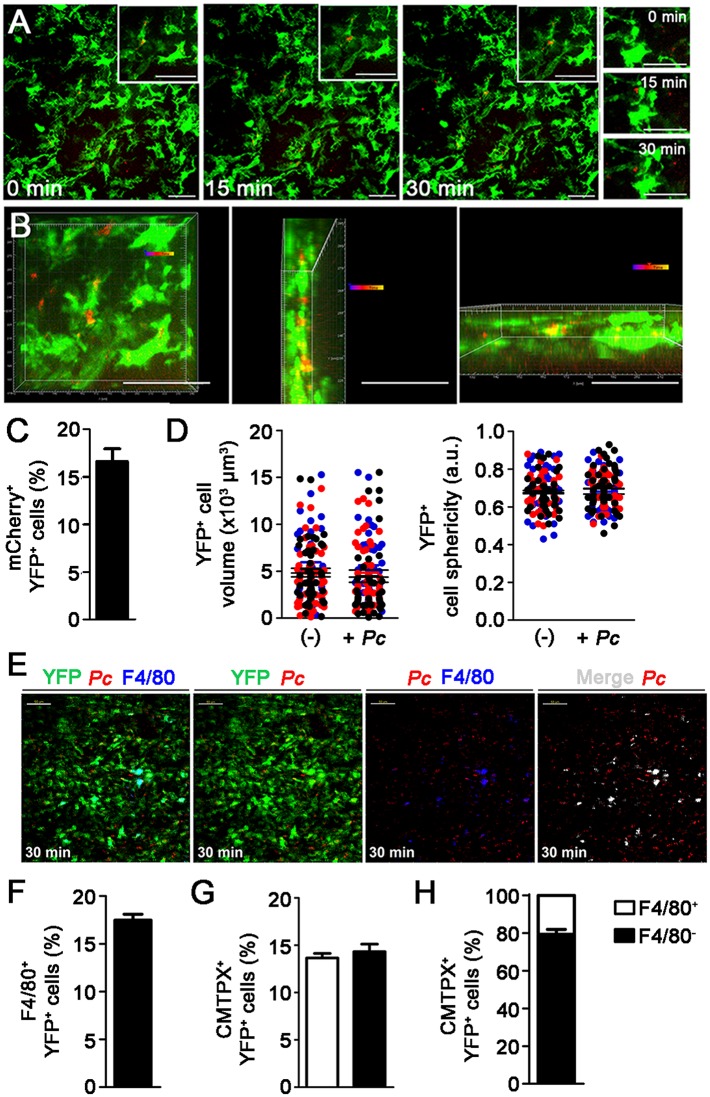
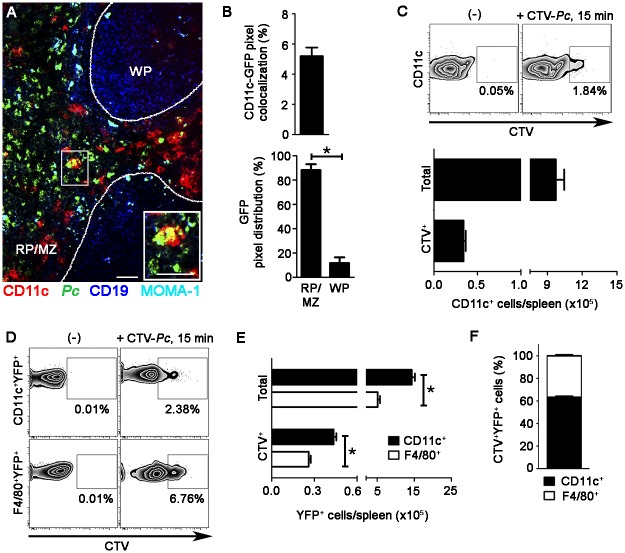
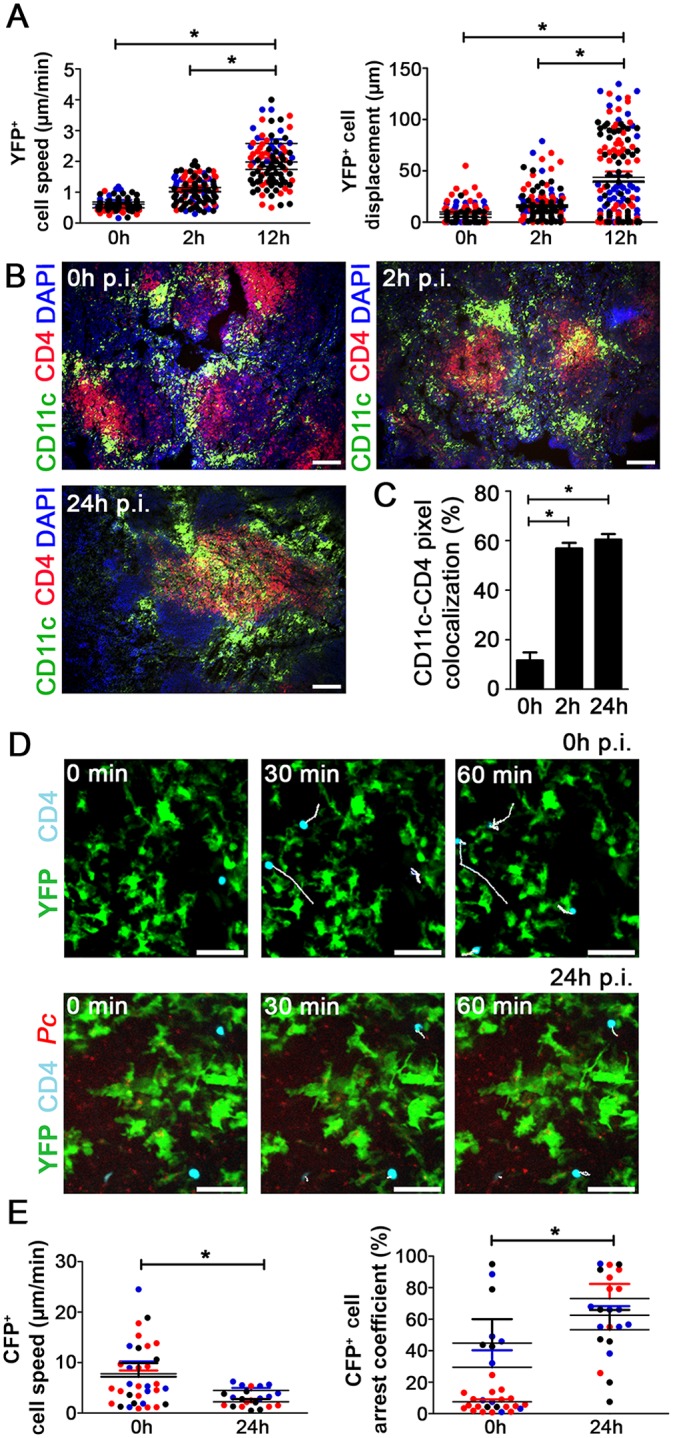
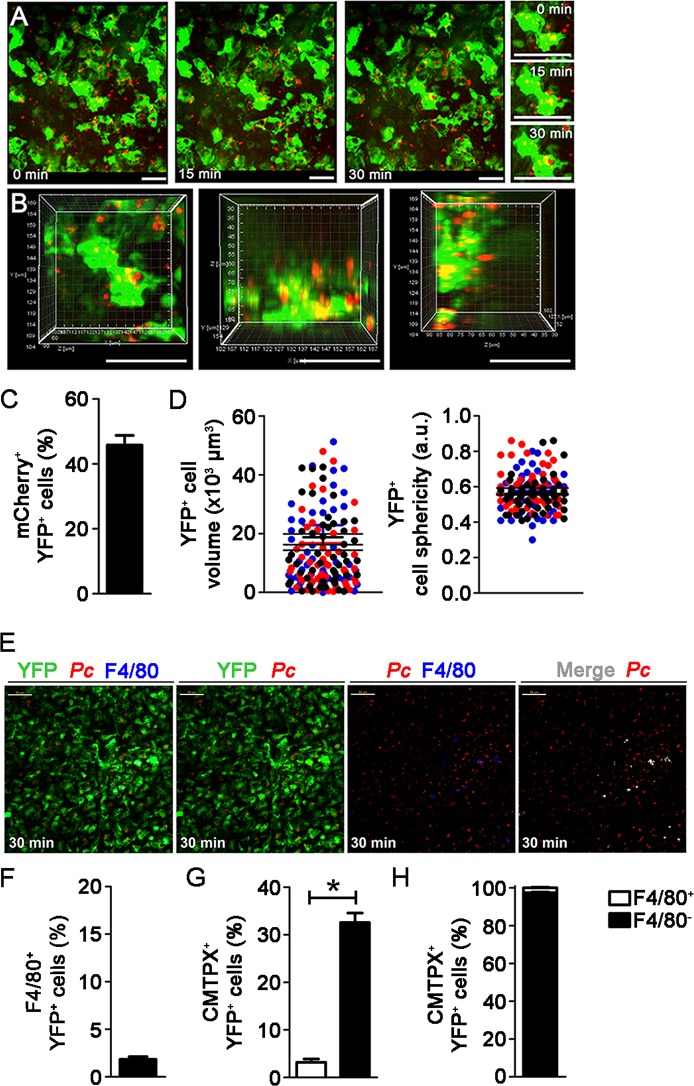
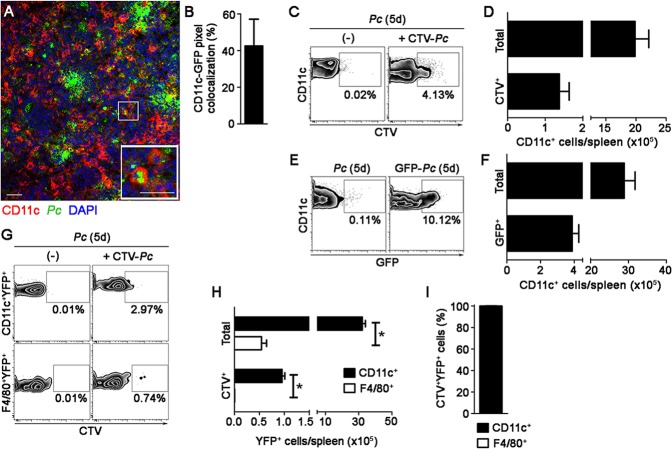
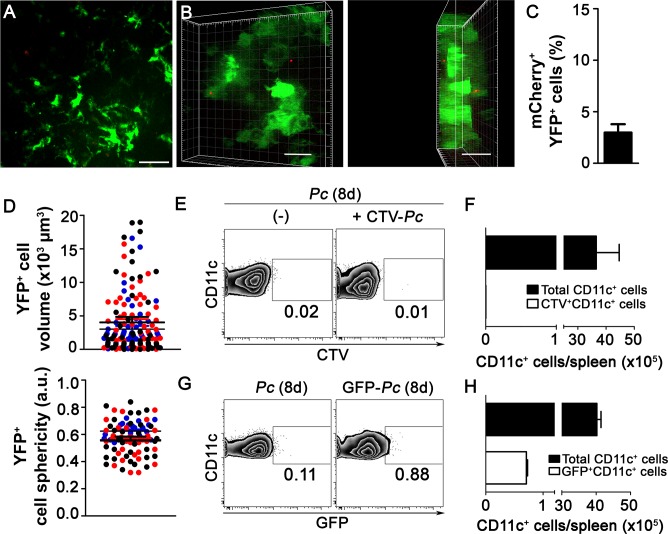
Dendritic cells (DCs) are phagocytes that are highly specialized for antigen presentation. Heterogeneous populations of macrophages and DCs form a phagocyte network inside the red pulp (RP) of the spleen, which is a major site for the control of blood-borne infections such as malaria. However, the dynamics of splenic DCs during Plasmodium infections are poorly understood, limiting our knowledge regarding their protective role in malaria. Here, we used in vivo experimental approaches that enabled us to deplete or visualize DCs in order to clarify these issues. To elucidate the roles of DCs and marginal zone macrophages in the protection against blood-stage malaria, we infected DTx (diphtheria toxin)-treated C57BL/6.CD11c-DTR mice, as well as C57BL/6 mice treated with low doses of clodronate liposomes (ClLip), with Plasmodium chabaudi AS (Pc) parasites. The first evidence suggesting that DCs could contribute directly to parasite clearance was an early effect of the DTx treatment, but not of the ClLip treatment, in parasitemia control. DCs were also required for CD4+ T cell responses during infection. The phagocytosis of infected red blood cells (iRBCs) by splenic DCs was analyzed by confocal intravital microscopy, as well as by flow cytometry and immunofluorescence, at three distinct phases of Pc malaria: at the first encounter, at pre-crisis concomitant with parasitemia growth and at crisis when the parasitemia decline coincides with spleen closure. In vivo and ex vivo imaging of the spleen revealed that DCs actively phagocytize iRBCs and interact with CD4+ T cells both in T cell-rich areas and in the RP. Subcapsular RP DCs were highly efficient in the recognition and capture of iRBCs during pre-crisis, while complete DC maturation was only achieved during crisis. These findings indicate that, beyond their classical role in antigen presentation, DCs also contribute to the direct elimination of iRBCs during acute Plasmodium infection.


Conflict of interest statement

The authors have declared that no competing interests exist.

Figures

Figure 1
Figure 1. Effects of DC depletion on acute Pc malaria.
(A-F) B6 and B6.CD11c-DTR mice were treated with either DTx to deplete CD11c+ cells or PBS as a control. The mice were i.p. infected with 1 × 10⁶ Pc iRBCs 24 h later. (A) Representative contour plots obtained 24 h after treatment by flow cytometry confirm the efficiency of DTx-induced depletion of splenic CD11c+I-A+ cells in B6.CD11c-DTR mice. Data show the percentages of CD11c+I-A+ cells in the splenocyte population. (B) Parasitemia curves are shown (means ± SD). (C) Variations in body weight relative to day 0 are shown (means ± SD). (D) Survival curves are shown. (E) Data show the numbers of CD3+CD4+ T cells per spleen at days 0 and 4 p.i. (means ± SD). (F) Data show the percentages of proliferating CFSElowCD4+ T cells and IFN-γ concentrations in the supernatants of spleen cell cultures stimulated for 72 h with iRBCs (means ± SD). In B-D, significant differences (p < 0.05) between the indicated groups are designated by *. In E and F, significant differences (p < 0.05) between all other groups are designated by *. In A-F, one representative experiment out of three (n = 5) is shown.
Figure 2
Figure 2. In vivo analysis of iRBC uptake by subcapsular RP DCs soon after Pc infection.
(A-D) B6.CD11c-YFP mice were i.v. infected with 1 × 10⁸ mature mCherry-Pc iRBCs. Spleens were analyzed by CIVM after 15 min and in non-infected controls. (A) Serial snapshots taken at 15 min p.i. (0 min) show the subcapsular RP. The upper panels show the amplification of a few cells co-expressing YFP (green) and mCherry (red). In the image on the right, a region showing contact between YFP+ cells and mCherry-Pc iRBCs is magnified. (B) CIVM 3D animation reveals that YFP+ cells contain mCherry-Pc iRBC remnants (yellow spots of merged mCherry/YFP-3D signal). (C) Percentage of mCherry+ cells in the YFP+ cell population is shown (mean ± SEM). (D) YFP+ cell volume and sphericity are shown for naïve mice (-) and recently infected mice (+Pc). Black, red and blue dots are from three different experiments. Horizontal lines represent mean values and SEM. (E-H) B6.CD11c-YFP mice were i.v. infected with 1 × 10⁸ mature CMTPX-Pc iRBCs. After 15 min, mice were injected i.v. with a fluorescent anti-F4/80 mAb and the spleens were analyzed by CIVM. (E) Snapshots taken 30 min later show YFP+ cells (green), iRBCs (red), F4/80+ cells (blue) and merged F4/80+YFP+ cells (white) in the subcapsular RP. (F) Percentage of F4/80+ cells in the YFP+ cell population is shown (mean ± SEM). (G) Percentages of CMTPX+ cells in the F4/80+YFP+ and F4/80-YFP+ cell subsets are shown (means ± SEM). (H) The relative proportions of F4/80+ and F4/80- cells in the CMTPX+YFP+ cell population were calculated from the data obtained in F and G (means ± SEM). In A, B and E, the scale bars correspond to 50 µm. One representative experiment out of three (n = 2) is shown. In C, D, F, G and H, data were calculated using Imaris software. Data from three experiments (n = 2) are shown.
Figure 3
Figure 3. Ex vivo analysis of iRBC uptake by splenic DCs soon after Pc infection.
(A-C) B6 mice were i.v. infected with 1 × 10⁸ purified mature CTV-Pc iRBCs (flow cytometry) or GFP-Pc iRBCs (immunofluorescence). Spleens were analyzed after 15 min and in non-infected controls. (A) A representative immunofluorescence image (10x magnification) shows the spleen of an infected B6 mouse. The staining of MOMA-1+ metallophilic macrophages and CD19+ B cells delineates the RP/MZ from the white pulp (WP). The lower panel details a merged GFP+CD11c+ cell in the RP. (B) Percentage of CD11c pixels colocalized with GFP pixels and percentages of GFP pixel distribution in the splenic RP/MZ and WP were obtained from immunofluorescence images (means ± SD). (C) Representative contour plots obtained by flow cytometry show CTV staining in the CD11c+ cells of naïve mice (-) and recently infected mice. CD11c+ cells in the CD3-CD19-DX5-Ter119- cell population were analyzed, while excluding T cells, B cells, NK cells and RBCs. Data in contour plots show the percentages of CTV+ cells in the CD11c+ cell population. The numbers of total and CTV+CD11c+ cells per spleen in recently infected mice were calculated from the data obtained in contour plots (means ± SD). (D-F) B6.CD11c-YFP mice were i.v. infected with 1 × 10⁸ purified mature CTV-Pc iRBCs. Spleens were analyzed by flow cytometry after 15 min and in non-infected controls. (D) Representative contour plots show CTV staining in the CD11c+YFP+ and F4/80+YFP+ cells. Data show the percentages of CTV+ cells in each population. (E) The numbers of total and CTV+ CD11c+YFP+ and F4/80+YFP+ cells per spleen were calculated from the data obtained in D (means ± SD). (F) The relative proportions of CD11c+ and F4/80+ cells in the CTV+YFP+ cell population were calculated from the data obtained in E (means ± SD). In A, the scale bars correspond to 50 µm. In B, data were calculated using FIJI software. In B and E, significant differences (p < 0.05) between the indicated groups are designated by *. In A-F, one representative experiment out of three (n = 3-4) is shown.
Figure 4
Figure 4. Analysis of the interactions between splenic DCs and CD4+ T cells after Pc infection.
(A) B6.CD11c-YFP mice were i.p. infected with 1 × 10⁶ mCherry-Pc iRBCs. Spleens were analyzed by CIVM after 2 h and 12 h and in non-infected controls. Speed and displacement of YFP+ cells are shown. Black, red and blue dots are from three different experiments. Horizontal lines represent mean values and SEM. (B and C) B6 mice were i.p. infected with 1 × 10⁶ mCherry-Pc iRBCs. Spleens were analyzed after 2 h or 24 h and in non-infected controls. (B) Representative immunofluorescence images (10x magnification) show CD11c+ cells and CD4+ cells in DAPI-stained tissue sections. (C) Percentages of CD11c pixels colocalized with GFP pixels in the immunofluorescence images are shown (means ± SD). (D and E) B6.CD11c-YFP mice were adoptively transferred with 5 × 10⁶ CFP+CD4+ T cells and i.p. infected with 1 × 10⁶ mCherry-Pc iRBCs. Spleens were analyzed by CIVM after 24 h and in non-infected controls. (D) Snapshots show the subcapsular RP with CFP+CD4+ cell tracking. (E) Speed and arrest coefficients of CFP+CD4+ cells are shown. Black, red and blue dots are from three different experiments. Horizontal lines represent mean values and SEM. In B and D, the scale bars correspond to 100 and 50 µm, respectively. In A, C and E, significant differences (p < 0.05) between the indicated groups are designated by *. In A and E, data were calculated using Imaris software. Data from three experiments (n = 2) are shown. In C, data were calculated from eight images (two images per mouse) using FIJI software. In B and C, one representative experiment out of three (n = 4) is shown. In D, one representative experiment out of three (n = 2) is shown.
Figure 5
Figure 5. In vivo analysis of iRBC uptake by subcapsular RP DCs during pre-crisis.
(A-D) B6.CD11c-YFP mice were i.p. infected with 1 × 10⁶ mCherry-Pc iRBCs. Spleens were analyzed by CIVM after five days, at a time of day when mature parasite stages predominated. (A) Serial snapshots show the subcapsular RP and, in the right panel, a detailed image of a YFP+ cell (green) upon phagocytosis of an mCherry-Pc iRBC (red). (B) CIVM 3D animation shows the presence of mCherry-Pc iRBC remnants (yellow spots of merged mCherry/YFP-3D signal) inside the YFP+ cells. (C) Percentage of mCherry+ cells in the YFP+ cell population is shown (mean ± SEM). (D) YFP+ cell volume and sphericity are shown. Black, red and blue dots are from three different experiments. Horizontal lines represent mean values and SEM. (E-H) B6.CD11c-YFP mice were i.p. infected with 1 × 10⁶ Pc iRBCs. At five days p.i., mice were i.v. infected with 1 × 10⁸ mature CMTPX-Pc iRBCs. After 15 min, mice were injected i.v. with a fluorescent anti-F4/80 mAb and the spleens were analyzed by CIVM. (E) Snapshots taken 30 min later show YFP+ cells (green), iRBCs (red), F4/80+ cells (blue) and merged F4/80+YFP+ cells (white) in the subcapsular RP. (F) Percentage of F4/80+ cells in the YFP+ cell population is shown (mean ± SEM). (G) Percentages of CMTPX+ cells in the F4/80+YFP+ and F4/80-YFP+ cell subsets are shown (means ± SEM). (H) The relative proportions of F4/80+ and F4/80- cells in the CMTPX+YFP+ cell population were calculated from the data obtained in F and G (means ± SEM). In A, B and E, the scale bars correspond to 50 µm. One representative experiment out of three (n = 2) is shown. Data were calculated using Imaris software. In C, D, F, G and H, data were calculated using Imaris software. Data from three experiments (n = 2) are shown. In G, significant differences (p < 0.05) between the indicated groups are designated by *.
Figure 6
Figure 6. Ex vivo analysis of iRBC uptake by splenic DCs during pre-crisis.
(A and B) B6 mice were i.p. infected with 1 × 10⁶ GFP-Pc iRBCs. Spleens were analyzed after five days, at a time of day when mature parasite stages predominated. (A) A representative immunofluorescence image (10x magnification) represents the spleens of GFP-Pc-infected mice. The lower panel details a merged GFP+CD11c+ cell. (B) Percentage of CD11c pixels colocalized with GFP pixels in the immunofluorescence images is shown (mean ± SD). (C and D) B6 mice were i.p. infected with 1 × 10⁶ Pc iRBCs. At five days p.i., half of the B6 mice were i.v. re-infected with 1 × 10⁸ mature CTV-Pc iRBCs. Spleens were analyzed by flow cytometry after 15 min. (C) Representative contour plots show CTV staining in the CD11c+ cells of Pc-infected mice that were re-infected or not with CTV-Pc iRBCs. CD11c+ cells in the CD3-CD19-DX5-Ter119- cell population were analyzed. Data show the percentages of CTV+ cells in the CD11c+ cell population. (D) Numbers of total and CTV+CD11c+ cells per spleen in re-infected mice were calculated from the data obtained in C (means ± SD). (E and F) B6 mice were i.p. infected with 1 × 10⁶ Pc iRBCs or GFP-Pc iRBCs. Spleens were analyzed after five days, at a time of day when mature parasite stages predominated. (E) Representative contour plots obtained by flow cytometry show GFP staining in the CD11c+ cells of mice that were infected with Pc iRBCs or GFP-Pc iRBCs. CD11c+ cells in the CD3-CD19-DX5-Ter119- cell population were analyzed. Data show the percentages of GFP+ cells in the CD11c+ cell population. (F) Numbers of total and GFP+CD11c+ cells per spleen in GFP-Pc-infected mice were calculated from the data obtained in E. (G-I) B6.CD11c-YFP mice were i.p. infected with 1 × 10⁶ Pc iRBCs. At five days p.i., half of the B6.CD11c-YFP mice were i.v. re-infected with 1 × 10⁸ mature CTV-Pc iRBCs. Spleens were analyzed by flow cytometry after 15 min. (G) Representative contours plots show CTV staining in the CD11c+YFP+ and F4/80+YFP+ cells. Data show the percentages of CTV+ cells in each population. (H) The numbers of total and CTV+ CD11c+YFP+ and F4/80+YFP+ cells per spleen were calculated from the data obtained in G (means ± SD). (I) The relative proportions of CD11c+ and F4/80+ cells in the CTV+YFP+ cell population were calculated from the data obtained in H (means ± SD). In A, the scale bars correspond to 50 µm. In B, data were calculated using FIJI software. InH, significant differences (p < 0.05) between the indicated groups are designated by *. In A-I, one representative experiment out of three (n = 3-4) is shown.
Figure 7
Figure 7. In vivo and ex vivo analysis of iRBC uptake by splenic DCs during crisis.
(A-D) B6.CD11-YFP mice were i.p. infected with 1 × 10⁶ mCherry-Pc iRBCs. Spleens were analyzed by CIVM after eight days, at a time of day when mature parasite stages predominated. (A) A snapshot shows the subcapsular RP. (B) CIVM 3D animation shows the presence of few mCherry-Pc iRBCs (red) attached to YFP+ cells (green). (C) Percentage of mCherry+ cells in the YFP+ cell population is shown (mean ± SEM). (D) YFP+ cell volume and sphericity are shown. Black, red and blue dots are from three different experiments. Horizontal lines represent mean values and SEM. (E and F) B6 mice were i.p. infected with 1 × 10⁶ Pc iRBCs. At eight days p.i., half of the B6 mice were re-infected i.v. with 1 × 10⁸ purified mature CTV-Pc iRBCs. Spleens were analyzed by flow cytometry after 15 min. (E) Representative contour plots show CTV staining in the CD11c+ cells of Pc-infected mice that were re-infected or not with CTV-Pc iRBCs. CD11c+ cells in the CD3-CD19-DX5-Ter119- cell population were analyzed. Data show the percentages of CTV+ cells in the CD11c+ cell population. (F) The numbers of total and CTV+CD11c+ cells per spleen were calculated from the data obtained in E (means ± SD). (G and H) B6 mice were i.p. infected with 1 × 10⁶ Pc iRBCs or GFP-Pc iRBCs. Spleens were analyzed after eight days, at a time of day when mature parasite stages predominated. (G) Representative contour plots obtained by flow cytometry show GFP staining in CD11c+ cells of mice that were infected with Pc iRBCs or GFP-Pc iRBC. CD11c+ cells in the CD3-CD19-DX5-Ter119- cell population were analyzed. Data show the percentages of GFP+ cells in the CD11c+ cell population. (H) Numbers of total and GFP+CD11c+ cells per spleen were calculated from the data obtained in G. In A and B, the scale bars correspond to 50 µm and 30 µm, respectively. One representative experiment out of three (n = 2) is shown. In C and D, data were obtained using Imaris software. Data from three experiments (n = 2) are shown. In E-H, one representative experiment out of three (n = 5) is shown.

References

    1. Steiniger B, Barth P (2000) Microanatomy and function of the spleen. Adv Anat Embryol Cell Biol 151: III–IX, 1–101. - PubMed
    1. Mebius RE, Kraal G (2005) Structure and function of the spleen. Nat Rev Immunol 5: 606–616. 10.1038/nri1669 - DOI - PubMed
    1. Ishikawa-Sekigami T, Kaneko Y, Okazawa H, Tomizawa T, Okajo J, et al. (2006) SHPS-1 promotes the survival of circulating erythrocytes through inhibition of phagocytosis by splenic macrophages. Blood 107: 341–348. 10.1182/blood-2005-05-1896 - DOI - PubMed
    1. Hawkes M, Li X, Crockett M, Diassiti A, Finney C, et al. (2010) CD36 deficiency attenuates experimental mycobacterial infection. BMC Infect Dis 10: 299 10.1186/1471-2334-10-299 - DOI - PMC - PubMed
    1. Hou TZ, Bystrom J, Sherlock JP, Qureshi O, Parnell SM, et al. (2010) A distinct subset of podoplanin (gp38) expressing F4/80+ macrophages mediate phagocytosis and are induced following zymosan peritonitis. FEBS Lett 584: 3955–3961. 10.1016/j.febslet.2010.07.053 - DOI - PubMed

Publication types