. 2015 Feb 6;11(2):e1004941.
doi: 10.1371/journal.pgen.1004941. eCollection 2015 Feb.

GC-Content evolution in bacterial genomes: the biased gene conversion hypothesis expands

Affiliations

GC-Content evolution in bacterial genomes: the biased gene conversion hypothesis expands

Florent Lassalle et al. PLoS Genet. .

Abstract

The characterization of functional elements in genomes relies on the identification of the footprints of natural selection. In this quest, taking into account neutral evolutionary processes such as mutation and genetic drift is crucial because these forces can generate patterns that may obscure or mimic signatures of selection. In mammals, and probably in many eukaryotes, another such confounding factor called GC-Biased Gene Conversion (gBGC) has been documented. This mechanism generates patterns identical to what is expected under selection for higher GC-content, specifically in highly recombining genomic regions. Recent results have suggested that a mysterious selective force favouring higher GC-content exists in Bacteria but the possibility that it could be gBGC has been excluded. Here, we show that gBGC is probably at work in most if not all bacterial species. First we find a consistent positive relationship between the GC-content of a gene and evidence of intra-genic recombination throughout a broad spectrum of bacterial clades. Second, we show that the evolutionary force responsible for this pattern is acting independently from selection on codon usage, and could potentially interfere with selection in favor of optimal AU-ending codons. A comparison with data from human populations shows that the intensity of gBGC in Bacteria is comparable to what has been reported in mammals. We propose that gBGC is not restricted to sexual Eukaryotes but also widespread among Bacteria and could therefore be an ancestral feature of cellular organisms. We argue that if gBGC occurs in bacteria, it can account for previously unexplained observations, such as the apparent non-equilibrium of base substitution patterns and the heterogeneity of gene composition within bacterial genomes. Because gBGC produces patterns similar to positive selection, it is essential to take this process into account when studying the evolutionary forces at work in bacterial genomes.


Conflict of interest statement

The authors have declared that no competing interests exist.

Figures
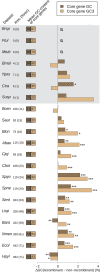
Figure 1
Figure 1. Effect of recombination on core genes GC-content.
Difference in average GC-content of recombinant and non-recombinant genes, measured on entire CDS length (GC, dark brown) or at third codon position only (GC3, light brown) in the core genome of each dataset. Recombinant status was determined using the PHI test [28] (p < 0.05) on alignments of core gene families trimmed to a common length of 900bp. A positive difference indicates that recombinant families are enriched in GC. Stars indicate the level of significance of a Student’s t-test (“*”, p < 0.05; “**”, p < 0.01; “***”, p < 0.001). Statistical tests are detailed further in S1 Table. Dataset abbreviations are explained in Table 1. Figures next to dataset names indicate the number of recombinant core gene families in the dataset, figures in parenthesis indicate their percentage in the total pool of recombinant and non-recombinant families. Colored boxes on the right indicate the mean percentage of GC and GC3 values of core genes. Shading in background marks datasets with less than 20 recombinant gene families (detailed Table 1).
Figure 2
Figure 2. Effect of recombination on codon usage of core genes.
Difference in frequency of optimal (fop) or non-optimal (fnop) codons (as determined by RP method) in recombining and non-recombining genes in each dataset for AU-ending (redish colors) and GC-ending (blueish colors) codons. The recombination status of genes was determined as in Fig. 1, only datasets with more than 10% recombining genes are shown. A positive difference indicates that recombining genes are enriched in a category of codons, while a negative difference indicate depletion. Stars indicate significance of a Student’s t-test between recombining and non recombining genes. Colored boxes on the right of dataset names indicate the numbers of AU-ending and GC-ending optimal or non-optimal codons used by the taxon (detailed in S2 Table). Symbols and dataset abbreviations as in Fig. 1; shading is only used to distinguish between datasets. It should be noticed that variations in fopGC and fnopAU (resp. fopAU and fnopGC) are not totally independent (typically, for all amino-acids encoded by two synonymous codons, if the optimal codon is GC ending, the non-optimal is AT-ending).
Figure 3
Figure 3. Correlations between GC3 and estimates of recombination rate.
For each dataset, core genes are sorted by increasing GC3 and pooled into 20 classes of equal size. Correlations between the mean GC3 and mean recombination rate of each class are reported. (A) Correlation between GC3 and coalescent-based estimates of recombination rate for Homo sapiens (Hsap) and Stretococcus pyogenes (Spyo). For Hsap, recombination rate is expressed as cM∙Mb-1; a subset of 600 genes out of the 16,346 human genes is shown as a representative of 1,000 random samples (mean R2 is 55%, see Main Text). For Spyo, recombination rate is expressed as the value of rho parameter in ClonalOrigin [41] inferences, which is scaled by arbitrary coalescent time units; a subset of 437 genes out of 478 core genes was used, after removal of the 41 genes showing no convergence of the rho estimate (correlation on the full 478 core genes yields a R2 of 31%, see S1 Text). (B) Correlation between GC3 and PREC, the proportion of genes detected as recombinant by PHI test [28] in the class, for all 14 bacterial datasets showing sufficient evidence of recombination (Table 1).

References

    1. Doolittle WF (2013) Is junk DNA bunk? A critique of ENCODE. Proc Natl Acad Sci 110: 5294–5300. 10.1073/pnas.1221376110 - DOI - PMC - PubMed
    1. Bernardi G, Olofsson B, Filipski J, Zerial M, Salinas J, et al. (1985) The mosaic genome of warm-blooded vertebrates. Science 228: 953–958. - PubMed
    1. Sueoka N (1962) ON THE GENETIC BASIS OF VARIATION AND HETEROGENEITY OF DNA BASE COMPOSITION. Proc Natl Acad Sci 48: 582–592. - PMC - PubMed
    1. McCutcheon JP, Moran NA (2010) Functional convergence in reduced genomes of bacterial symbionts spanning 200 My of evolution. Genome Biol Evol 2: 708–718. 10.1093/gbe/evq055 - DOI - PMC - PubMed
    1. Pagani I, Liolios K, Jansson J, Chen I-MA, Smirnova T, et al. (2012) The Genomes OnLine Database (GOLD) v.4: status of genomic and metagenomic projects and their associated metadata. Nucleic Acids Res 40: D571–D579. 10.1093/nar/gkr1100 - DOI - PMC - PubMed

Publication types

Substances

LinkOut - more resources