. 2015 Feb 6;11(2):e1004607.
doi: 10.1371/journal.ppat.1004607. eCollection 2015 Feb.

IL-33-mediated protection against experimental cerebral malaria is linked to induction of type 2 innate lymphoid cells, M2 macrophages and regulatory T cells

Affiliations

IL-33-mediated protection against experimental cerebral malaria is linked to induction of type 2 innate lymphoid cells, M2 macrophages and regulatory T cells

Anne-Gaelle Besnard et al. PLoS Pathog. .

Abstract

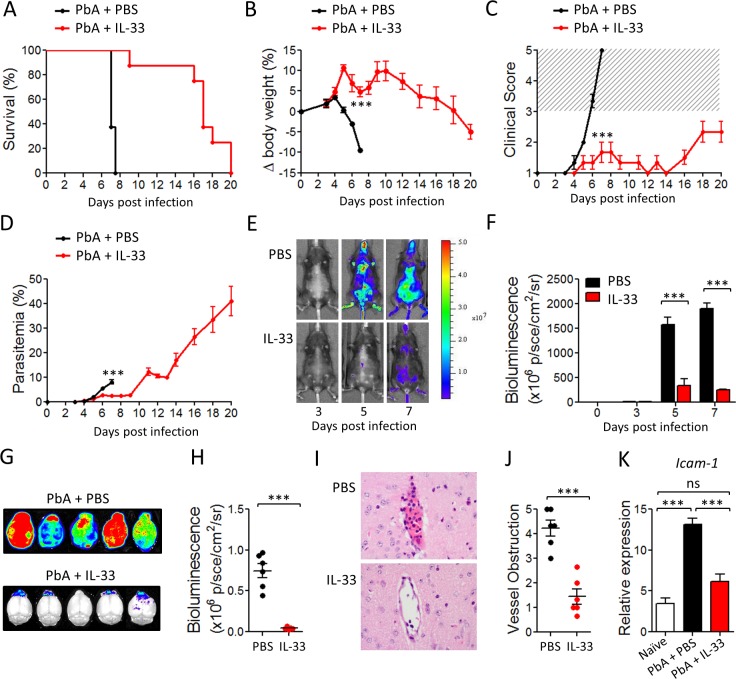
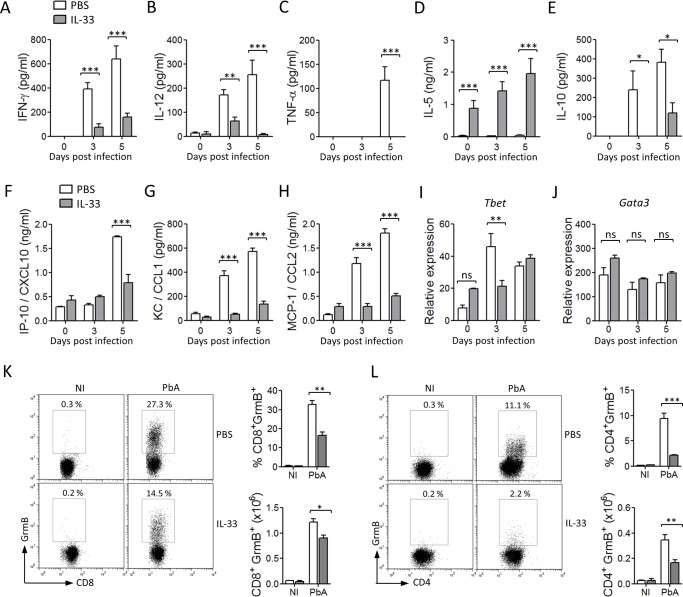
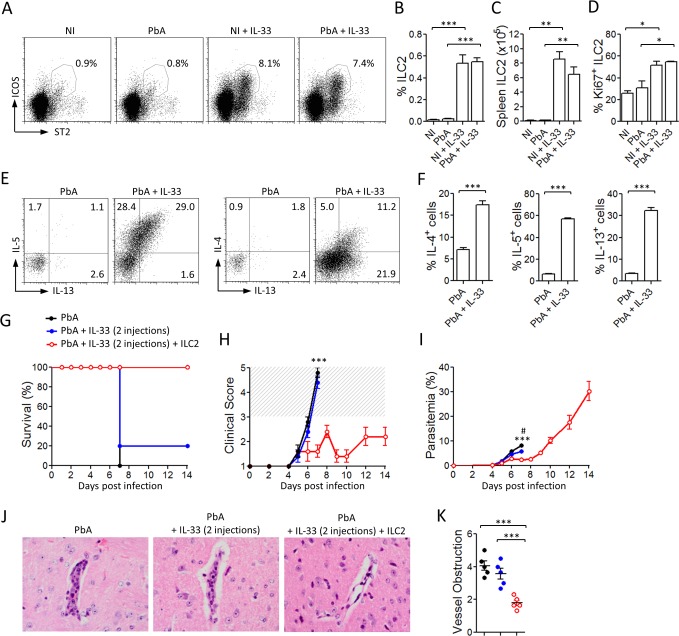
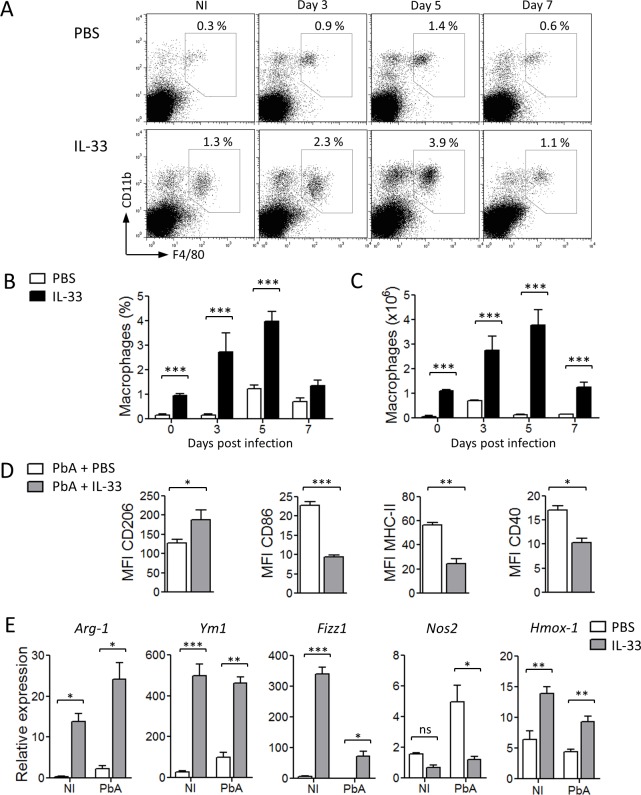
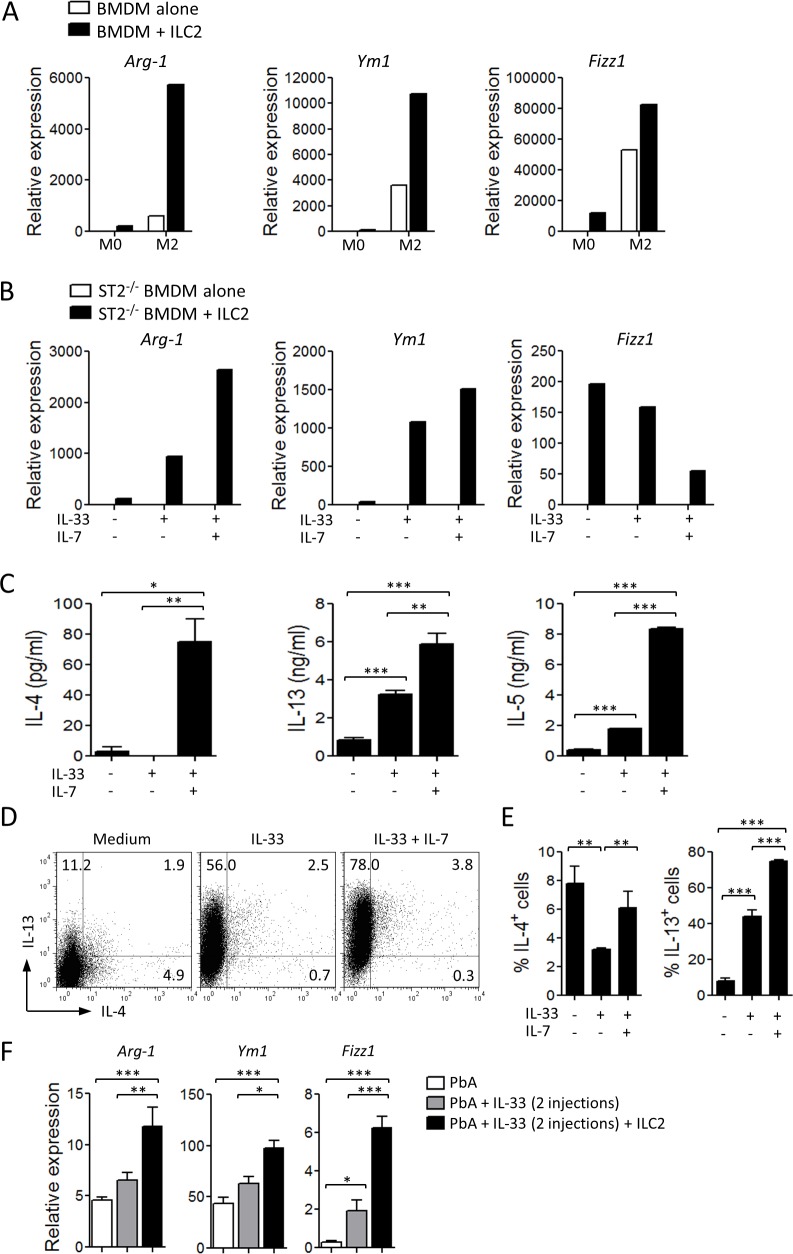
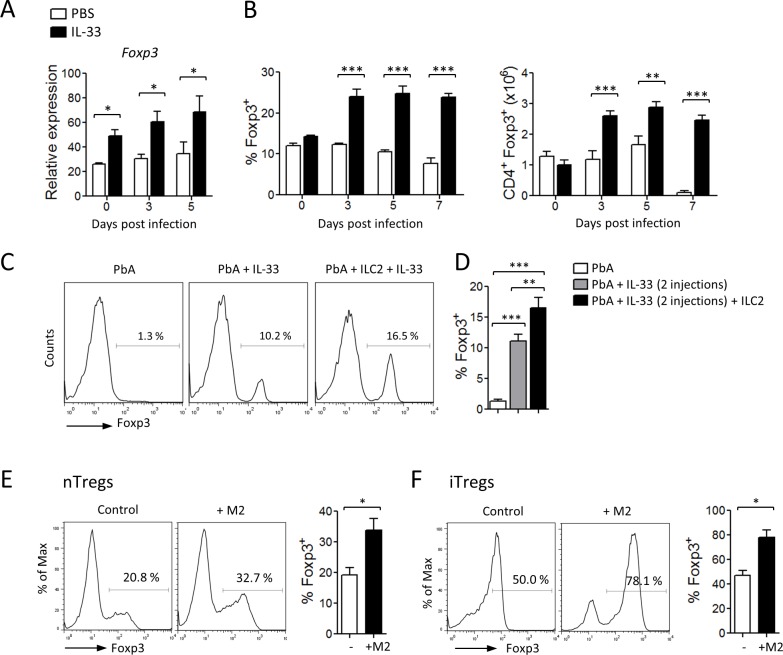
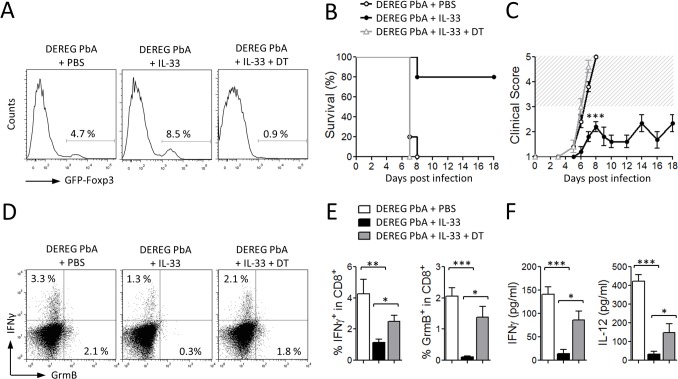
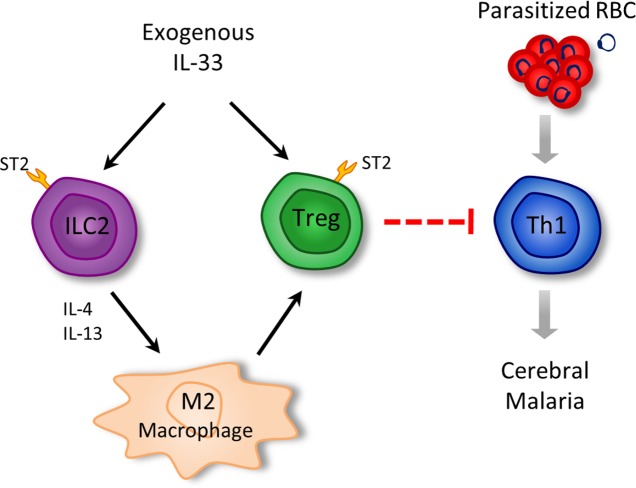
Cerebral malaria (CM) is a complex parasitic disease caused by Plasmodium sp. Failure to establish an appropriate balance between pro- and anti-inflammatory immune responses is believed to contribute to the development of cerebral pathology. Using the blood-stage PbA (Plasmodium berghei ANKA) model of infection, we show here that administration of the pro-Th2 cytokine, IL-33, prevents the development of experimental cerebral malaria (ECM) in C57BL/6 mice and reduces the production of inflammatory mediators IFN-γ, IL-12 and TNF-α. IL-33 drives the expansion of type-2 innate lymphoid cells (ILC2) that produce Type-2 cytokines (IL-4, IL-5 and IL-13), leading to the polarization of the anti-inflammatory M2 macrophages, which in turn expand Foxp3 regulatory T cells (Tregs). PbA-infected mice adoptively transferred with ILC2 have elevated frequency of M2 and Tregs and are protected from ECM. Importantly, IL-33-treated mice deleted of Tregs (DEREG mice) are no longer able to resist ECM. Our data therefore provide evidence that IL-33 can prevent the development of ECM by orchestrating a protective immune response via ILC2, M2 macrophages and Tregs.


Conflict of interest statement

The authors have declared that no competing interests exist.

Figures

Figure 1
Figure 1. IL-33 protects mice from PbA-induced cerebral malaria.
C57BL/6 mice were infected i.v. with Plasmodium berghei ANKA (PbA) (104 pRBCs) and injected i.p. daily with PBS or IL-33 (0.2 μg) from day 0. (A) Kaplan–Meier survival curves (pool of 3 experiments, n = 14–20 per group). (B) body weight loss (n = 5 per group); Statistical differences are shown for day 7. (C) Clinical score (n = 5 per group). The hatched area indicates ECM related scores. (D) Time-course analysis of parasitemia (n = 5 per group). (E) Parasite-derived bioluminescence. One representative mouse is shown at each time point. Radiance (P/Sec/cm2/Sr), color scale Min = 2×10⁶, Max = 5×10⁷. (F) Mean body bioluminescence (n = 5 per group). (G) Mice infected with PbA-Luc were sacrificed on day 7 and bioluminescence of the brain was recorded. (H) Mean brain bioluminescence per group (n = 6). (I) Representative H&E histopathology of brain vasculature from PBS- or IL-33-treated mice. Magnification ×400. (J) Severity of brain microvascular obstruction and local hemorrhage assessed from a whole-brain section (n = 6 per group). (K) Icam-1 mRNA expression (relative to Hprt1) in the brain determined by qPCR (n = 6 per group); Data are mean ± SEM. Representative data from 3 independent experiments were shown. ns, non significant, ***P<0.001.
Figure 2
Figure 2. IL-33 reduces pro-inflammatory cytokines and chemokines in PbA-infected mice.
C57BL/6 mice were not infected (NI) or infected with PbA and injected i.p. daily with PBS (open columns) or IL-33 (filled columns) from day 0 for 5 consecutive days. (A-H) Serum IFN-γ, IL-12, TNF-α, IL-5, IL-10, IP-10, KC and MCP-1 concentrations were determined by ELISA or Multiplex. Mean ± SEM (n = 5–7 per group). (I-J) Expression of Tbet and Gata3 mRNA (relative to Hprt1) in purified splenic CD4+ T cells was analysed by qPCR (n = 3 per group). Intracellular staining of Granzyme B (GrmB) in splenic CD8+ (K) and CD4+ (L) T cells on day 6. Data are mean ± SEM (n = 5–7 per group). ns, not significant, *P<0.05, **P<0.01, ***P<0.001 by two-tailed ANOVA.
Figure 3
Figure 3. IL-33 expands ILC2 which adoptively protect mice against ECM.
C57BL/6 mice were not infected (NI) or infected with PbA and treated daily with PBS or IL-33 from day 0. Splenic ILC2 were analysed by FACS on day 3. (A) Representative FACS showing % of ICOS+ST2+ cells gated on Lin CD45+ cells. Cumulative percentage (B) and number (C) of ILC2 per spleen are shown. (D) Percentage of Ki67+ ILC2. Data are mean ± SEM (n = 5 per group) and representative of 2 independent experiments. *P<0.05, **P<0.01, ***P<0.001 by two-tailed ANOVA. (E-F) Total spleen cells were restimulated ex vivo for 4 h with PMA/ionomycin and stained for intracellular cytokines. (E) Dot plots show expression of IL-4, IL-5 and IL-13 by ILC2 (gated on live LinCD45+ICOS+ST2+ cells) on day 3 post-infection. (F) Cumulative data shows mean ± SEM of cytokine production (n = 5 per group). Data are representative of 2 independent experiments. (G-K) ILC2 sorted from mice pre-treated with IL-33 were adoptively transferred (2×10⁶ cells, i.v., on day −1) into naïve C57BL/6 mice which were infected with PbA (104 pRBCs, i.v., on day 0). The recipients were given 2 injections of IL-33 (0.2 μg, i.p.) 30 min and 24 h after cell transfer. Survival (G), body weight loss (H) and parasitemia (I) were assessed daily. ***P<0.001 between PbA and PbA+IL-33+ILC2 groups; #P<0.05 between PbA and PbA+IL-33 groups. (J) Representative H&E staining of brain sections on day 7, magnification ×400. (K) Vessel obstruction scores in the brain (same colour code as in F). Data are mean ± SEM (n = 5 per group). ***P<0.001 by two-tailed ANOVA.
Figure 4
Figure 4. IL-33 polarizes M2 macrophages in PbA-infected mice.
C57BL/6 mice were not infected (NI) or infected i.v. with PbA and treated daily for 5 days with PBS or IL-33 and spleen cells were harvested at indicated time points and analysed. (A) Representative dotplots showing percentage of CD11b+F4/80+ cells among total splenocytes. (B) Percentages and (C) numbers of CD11b+F4/80+CD11c macrophages in the spleen. (D) Mean Fluorescence Intensity (MFI) of CD206, CD86, MHC-II and CD40 on macrophages (n = 5 per group). (E) Expression (relative to Hprt1) of Arg-1, Ym1, Fizz1, Nos2 and Hmox-1 mRNA in the spleen on day 5. Data are mean ± SEM, representative of 2 independent experiments. ns, not significant, *P<0.05, **P<0.01, ***P<0.001 by two-tailed ANOVA.
Figure 5
Figure 5. ILC2 promote M2 macrophage polarization.
(A) BMDM from C57BL/6 mice were cultured in the lower chamber of a 24-transwell plate in complete medium alone (M0) or supplemented with IL-4 (M2). In some experiments ILC2, sorted from naïve WT mice pre-treated with IL-33, were added to the upper chamber. After 48 h, BMDM were collected and assayed for the expression of M2 markers by qPCR (relative to Hprt1). (B) ST2-deficient BMDM were co-cultured in transwell plates as above with WT ILC2 in the presence of IL-33 alone or in combination with IL-7. After 48 h, BMDM were collected and assayed for the expression of M2 markers by qPCR (relative to Hprt1). Type 2 cytokines in the supernatants of ILC2 cultured in the presence of IL-33 or IL-33 + IL-7 were determined by ELISA (C), or by FACS (D, E). Data are mean ± SEM (n = 3 per group), representative of two independent experiments, *P<0.05, **P<0.01, ***P<0.001 by two-tailed ANOVA. (F) ILC2 sorted from mice pre-treated with IL-33 were adoptively transferred (2×10⁶ cells, i.v., on day −1) into naïve C57BL/6 mice which were infected with PbA (104 pRBCs, i.v., on day 0). The recipients, were given 2 injections of IL-33 (0.2 μg, i.p.) 30 min and 24 h after cell transfer. Expression of Arg-1, Ym1 and Fizz1 mRNA in the spleen was measured by qPCR (relative to Hprt1) on day 7. Data are mean ± SEM (n = 5 per group) *P<0.05, **P<0.01, ***P<0.001 by two-tailed ANOVA.
Figure 6
Figure 6. IL-33, ILC2 and M2 induce Tregs.
(A-C) C57BL/6 mice were infected i.v. with PbA and treated daily with PBS or IL-33 from day 0. (A) Relative expression (% of Hprt1) of Foxp3+ mRNA in purified CD4+ cells from the spleen. (B) percentage of Foxp3+ cells gated on CD4+ cells and number of Foxp3+CD4+ cells in the spleen. Data are mean ± SEM (n = 5 per group), representative of at least 2 independent experiments. *P<0.05, **P<0.01, ***P<0.001 by two-tailed ANOVA (C-D) ILC2 sorted from mice pre-treated with IL-33 were adoptively transferred (4×10⁶ cells, i.v., on day −1) into naïve C57BL/6 mice which were infected with PbA (104 pRBCs, i.v., on day 0). The recipients were given 2 injections of IL-33 (0.2 μg, i.p.) 30 min and 24 h after cell transfer. Spleen cells were harvested on day 7 and analysed by FACS for Foxp3 expression gated on CD4+ cells. Data are mean ± SEM (n = 5 per group). *P<0.05, **P<0.01, ***P<0.001 by two-tailed ANOVA. (E, F) M2 induce Tregs in vitro. (E) CD4+CD25+ T cells from naïve C57BL/6 mice were co-cultured with or without BMDM-derived M2 for 2 days and analysed for Foxp3 expression by FACS gated on live CD4+ cells. (F) CD4+CD25 T cells from naïve C57BL6 mice were cultured under iTreg polarizing conditions in the presence or absence of BMDM-derived M2 for 2 days and Foxp3 expression was analysed by FACS gated on live CD4+ cells. Data are mean ± SEM of 3 experiments. *P<0.05 by two-tailed ANOVA.
Figure 7
Figure 7. IL-33-mediated protection against ECM is Treg-dependent.
DEREG mice were infected with PbA (105 pRBC, i.p.) and daily treated with PBS or IL-33 for 5 consecutive days. Where indicated, mice received diphteria toxin (DT, 1 μg, i.p.) every second day from day 1. (A) Treg depletion was assessed in blood leukocytes on day 5 of infection by FACS on GFP-Foxp3 gated on CD4+ T cells, representative of 5 mice. (B) Survival (Kaplan–Meier survival curves) and (C) clinical score (hatched area indicates ECM related scores) of DEREG mice treated with PBS or IL-33 with or without DT (n = 4–5 per group) are shown. (D-E) Percentage of IFN-γ+ and Granzyme B+ (GrmB) CD8+ T cells in the spleen on day 5 post-infection was determined by FACS. (F) Serum IFN-γ and IL-12 concentrations were determined by ELISA (day 5) (n = 5 per group). Data are mean ± SEM representative of 2 experiments, *P<0.05, **P<0.01, ***P<0.001 by two-tailed ANOVA.
Figure 8
Figure 8. Schematic representation of the pathways by which IL-33 attenuates ECM.
Arrows represent activation/promotion; dotted blunted arrows = proposed mechanism of suppression.

Similar articles

Cited by

References

    1. World Health Organization (2012) World Malaria Report 2012.
    1. Belnoue E, Potter SM, Rosa DS, Mauduit M, Gruner AC, et al. (2008) Control of pathogenic CD8+ T cell migration to the brain by IFN-gamma during experimental cerebral malaria. Parasite Immunol 30: 544–553. 10.1111/j.1365-3024.2008.01053.x - DOI - PubMed
    1. Campanella GS, Tager AM, El Khoury JK, Thomas SY, Abrazinski TA, et al. (2008) Chemokine receptor CXCR3 and its ligands CXCL9 and CXCL10 are required for the development of murine cerebral malaria. Proc Natl Acad Sci U S A 105: 4814–4819. 10.1073/pnas.0801544105 - DOI - PMC - PubMed
    1. van der Heyde HC, Nolan J, Combes V, Gramaglia I, Grau GE (2006) A unified hypothesis for the genesis of cerebral malaria: sequestration, inflammation and hemostasis leading to microcirculatory dysfunction. Trends Parasitol 22: 503–508. 10.1016/j.pt.2006.09.002 - DOI - PubMed
    1. Shikani HJ, Freeman BD, Lisanti MP, Weiss LM, Tanowitz HB, et al. (2012) Cerebral malaria: we have come a long way. Am J Pathol 181: 1484–1492. 10.1016/j.ajpath.2012.08.010 - DOI - PMC - PubMed

Publication types

LinkOut - more resources