Clinical Trial
. 2015 Feb 6;10(2):e0117654.
doi: 10.1371/journal.pone.0117654. eCollection 2015.

Aberrant DNA damage response pathways may predict the outcome of platinum chemotherapy in ovarian cancer

Affiliations
Clinical Trial

Aberrant DNA damage response pathways may predict the outcome of platinum chemotherapy in ovarian cancer

Dimitra T Stefanou et al. PLoS One. .

Erratum in

Abstract

Ovarian carcinoma (OC) is the most lethal gynecological malignancy. Despite the advances in the treatment of OC with combinatorial regimens, including surgery and platinum-based chemotherapy, patients generally exhibit poor prognosis due to high chemotherapy resistance. Herein, we tested the hypothesis that DNA damage response (DDR) pathways are involved in resistance of OC patients to platinum chemotherapy. Selected DDR signals were evaluated in two human ovarian carcinoma cell lines, one sensitive (A2780) and one resistant (A2780/C30) to platinum treatment as well as in peripheral blood mononuclear cells (PBMCs) from OC patients, sensitive (n = 7) or resistant (n = 4) to subsequent chemotherapy. PBMCs from healthy volunteers (n = 9) were studied in parallel. DNA damage was evaluated by immunofluorescence γH2AX staining and comet assay. Higher levels of intrinsic DNA damage were found in A2780 than in A2780/C30 cells. Moreover, the intrinsic DNA damage levels were significantly higher in OC patients relative to healthy volunteers, as well as in platinum-sensitive patients relative to platinum-resistant ones (all P<0.05). Following carboplatin treatment, A2780 cells showed lower DNA repair efficiency than A2780/C30 cells. Also, following carboplatin treatment of PBMCs ex vivo, the DNA repair efficiency was significantly higher in healthy volunteers than in platinum-resistant patients and lowest in platinum-sensitive ones (t1/2 for loss of γH2AX foci: 2.7±0.5h, 8.8±1.9h and 15.4±3.2h, respectively; using comet assay, t1/2 of platinum-induced damage repair: 4.8±1.4h, 12.9±1.9h and 21.4±2.6h, respectively; all P<0.03). Additionally, the carboplatin-induced apoptosis rate was higher in A2780 than in A2780/C30 cells. In PBMCs, apoptosis rates were inversely correlated with DNA repair efficiencies of these cells, being significantly higher in platinum-sensitive than in platinum-resistant patients and lowest in healthy volunteers (all P<0.05). We conclude that perturbations of DNA repair pathways as measured in PBMCs from OC patients correlate with the drug sensitivity of these cells and reflect the individualized response to platinum-based chemotherapy.


Conflict of interest statement

Competing Interests: The authors have declared that no competing interests exist.

Figures

Fig 1
Fig 1. Changes in key molecules of the DDR pathways in ovarian carcinoma cell lines.
A2780/C30 cells (representative of the two OC cell lines) were treated (A) with cisplatin (0–100μg/ml) for 3h, or (B) with 100μg/ml cisplatin, subsequently incubated in drug-free medium for various time-periods (0–24h), or (C) with relatively small doses (0–15μg/ml) of cisplatin for up to 3h, and analyzed at the end of the treatment using confocal microscopy. Positive cells: cells with more than 5 foci per cell. The error bars represent standard deviation. In (D) typical images showing the key molecules under study using microscope analysis of A2780/C30 cells treated with 100μg/ml of cisplatin for 3h; upper images, immunofluorescence antigen staining; bottom images, cell nuclei labeled with DAPI. (E) A2780/C30 cells were treated with carboplatin (0–300μg/ml) for 24h or (F) with 100μg/ml carboplatin for various time-periods (0–24h) and analyzed using confocal microscopy. The error bars represent standard deviation. All assays were performed in triplicate.
Fig 2
Fig 2. Measurement of DNA damage in ovarian carcinoma cell lines using alkaline comet assay.
A2780/C30 cells (representative of the two OC cell lines) were treated with (A) cisplatin (0–150μg/ml) for 3h or (B) carboplatin (0–300μg/ml) for 24h, and analyzed at the end of the treatment using comet assay. The error bars represent standard deviation. In (C) typical comet assay images of A2780/C30 cells non-treated (NT), treated with 50μg/ml cisplatin (cis-50), 100μg/ml cisplatin (cis-100), 150μg/ml carboplatin (carbo-150) or 300μg/ml carboplatin (carbo-300). All assays were performed in triplicate.
Fig 3
Fig 3. Changes in key molecules of the DDR pathways and comet assay in PBMCs from healthy volunteers.
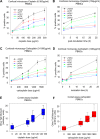
PBMCs from nine healthy volunteers were ex vivo treated (A) with cisplatin (0–300μg/ml) for 3h or (B) with 150μg/ml cisplatin, subsequently incubated in drug-free medium for various time-periods (0–24h), and analyzed thereafter using confocal microscopy. Also, PBMCs from the same healthy volunteers were treated (C) with carboplatin (0–1800μg/ml) for 24h or (D) with 1400μg/ml carboplatin for various times (0–24h) and analyzed at the end of the treatment using confocal microscopy. The error bars represent standard deviation. Finally, PBMCs were treated with (E) cisplatin (0–150μg/ml) for 3h or (F) carboplatin (0–1800μg/ml) for 24h and analyzed thereafter using comet assay. Box plots show statistical distribution of the levels of DNA damage. The horizontal lines within the boxes represent the median values and the vertical lines extending above and below the box indicate maximum and minimum values, respectively. All assays were performed in triplicate.
Fig 4
Fig 4. Intrinsic and carboplatin-induced DNA damage in PBMCs from healthy volunteers and OC patients.
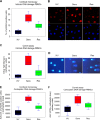
(A) Box plots showing statistical distribution of the levels of the intrinsic DNA damage in untreated PBMCs using immunofluorescence quantification of γH2AX. HV, healthy volunteers; Sens: OC patients sensitive to subsequent platinum therapy; Res: OC patients resistant to subsequent platinum therapy. (B) Typical images from confocal laser scanning microscope analysis of PBMCs from the three groups; upper images, γH2AX staining; bottom images, cell nuclei labeled with DAPI. (C) Box plots showing statistical distribution of the levels of the intrinsic DNA damage in untreated PBMCs using alkaline comet assay. (D) Typical comet images from untreated PBMCs of the three groups of individuals. Box plots showing statistical distribution of the levels of DNA damage in PBMCs stimulated into proliferation using PHA and treated with carboplatin (0–1800μg/ml) for 24h, using (E) immunofluorescence quantification of γH2AX and (F) alkaline comet assay. The horizontal lines within the boxes represent the median values and the vertical lines extending above and below the box indicate maximum and minimum values, respectively. All assays were performed in triplicate.
Fig 5
Fig 5. The induction of the apoptotic pathway in carboplatin-treated PBMCs.
(A) Box plots showing statistical distribution of the individual apoptosis rates, expressed as doses of carboplatin inducing apoptosis in the three groups of individuals. HV, healthy volunteers; Sens: OC patients sensitive to subsequent platinum therapy; Res: OC patients resistant to subsequent platinum therapy. The correlations between the individual apoptosis rates and the DNA damage in PBMCs from the same individuals using γH2AX immunofluorescence staining (B) and comet assay (C) are presented. (D) Box plots showing statistical distribution of the levels of the pan-nuclear immunofluorescence γH2AX staining in the three groups of individuals. The horizontal lines within the boxes represent the median values and the vertical lines extending above and below the box indicate maximum and minimum values, respectively. (E) Correlation between pan-nuclear γH2AX staining and the individual apoptosis rates in the same samples. (F) Typical images showing pan-nuclear immunofluorescence γH2AX staining; upper images, γH2AX staining; bottom images, cell nuclei labeled with DAPI. All assays were performed in triplicate.

References

    1. Siegel R, Ma J, Zou Z, Jemal A (2014) Cancer Statistics. CA Cancer J Clin 64: 9–29. 10.3322/caac.21208 - DOI - PubMed
    1. Jayson GC, Kohn EC, Kitchener HC, Ledermann JA (2014) Ovarian cancer. Lancet 384: 1376–1388. 10.1016/S0140-6736(13)62146-7 - DOI - PubMed
    1. Kim A, Ueda Y, Naka T, Enomoto T (2012) Therapeutic strategies in epithelial ovarian cancer. J Exp Clin Cancer Res 31: 14 10.1186/1756-9966-31-14 - DOI - PMC - PubMed
    1. Holschneider CH, Berek JS (2000) Ovarian cancer: epidemiology, biology, and prognostic factors. Semin Surg Oncol 19: 3–10. - PubMed
    1. Ozols RF (2000) Management of advanced ovarian cancer consensus summary. Advanced Ovarian Cancer Consensus Faculty. Semin Oncol 27(3 Suppl 7): 47–49. - PubMed

Publication types

MeSH terms