. 2015 Oct 16;34(42):5395-405.
doi: 10.1038/onc.2014.468. Epub 2015 Feb 9.

Loss of the E3 ubiquitin ligase HACE1 results in enhanced Rac1 signaling contributing to breast cancer progression

Affiliations

Loss of the E3 ubiquitin ligase HACE1 results in enhanced Rac1 signaling contributing to breast cancer progression

E T Goka et al. Oncogene. .

Abstract

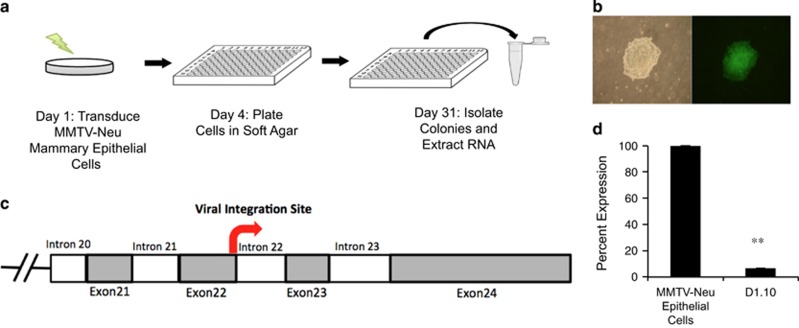
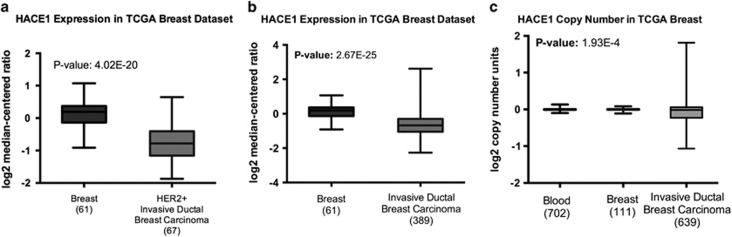
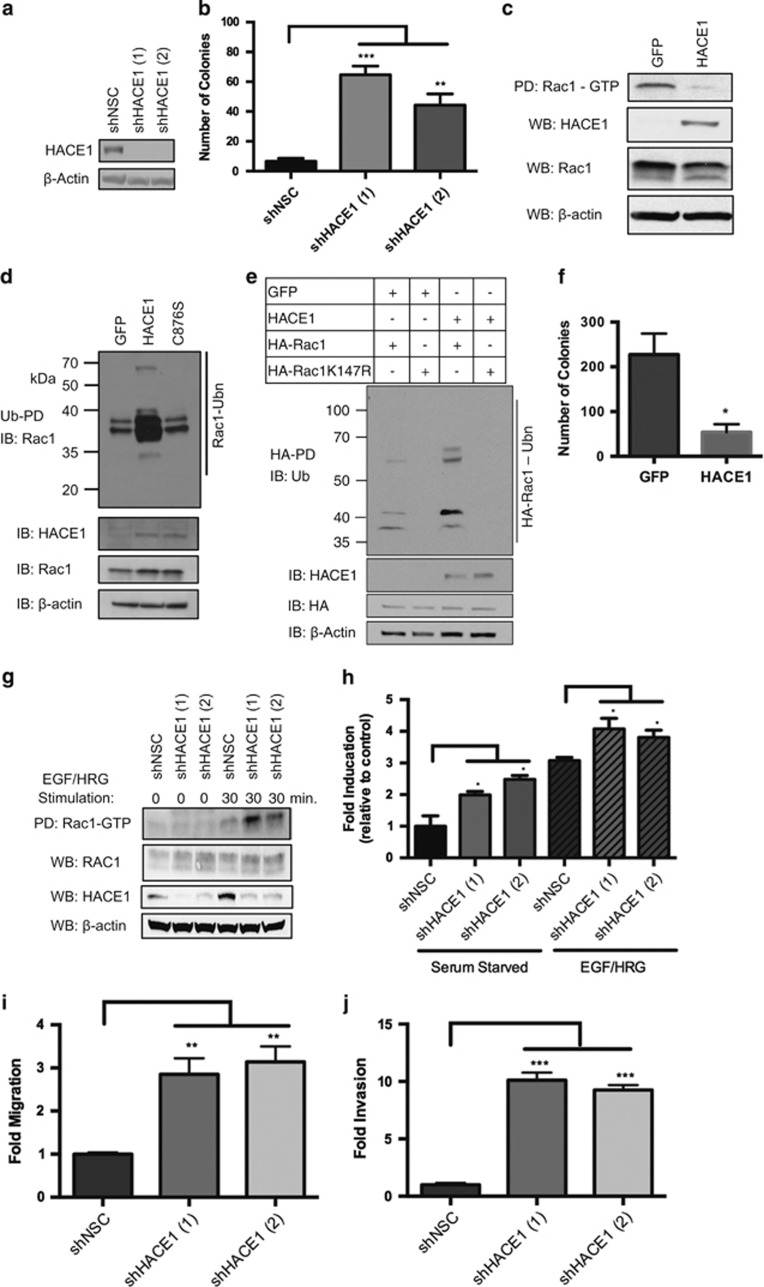
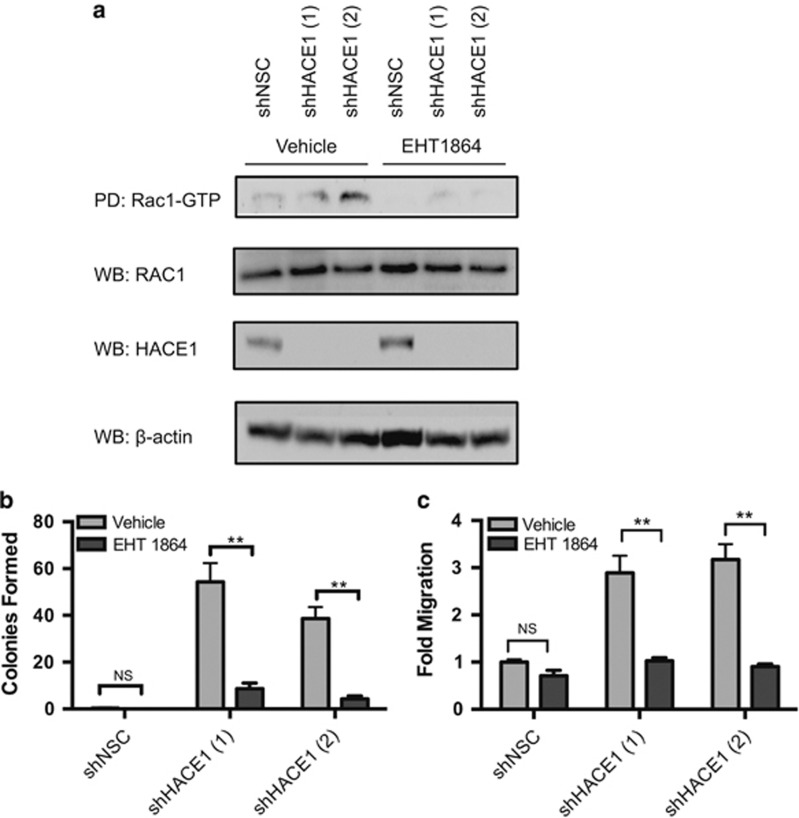
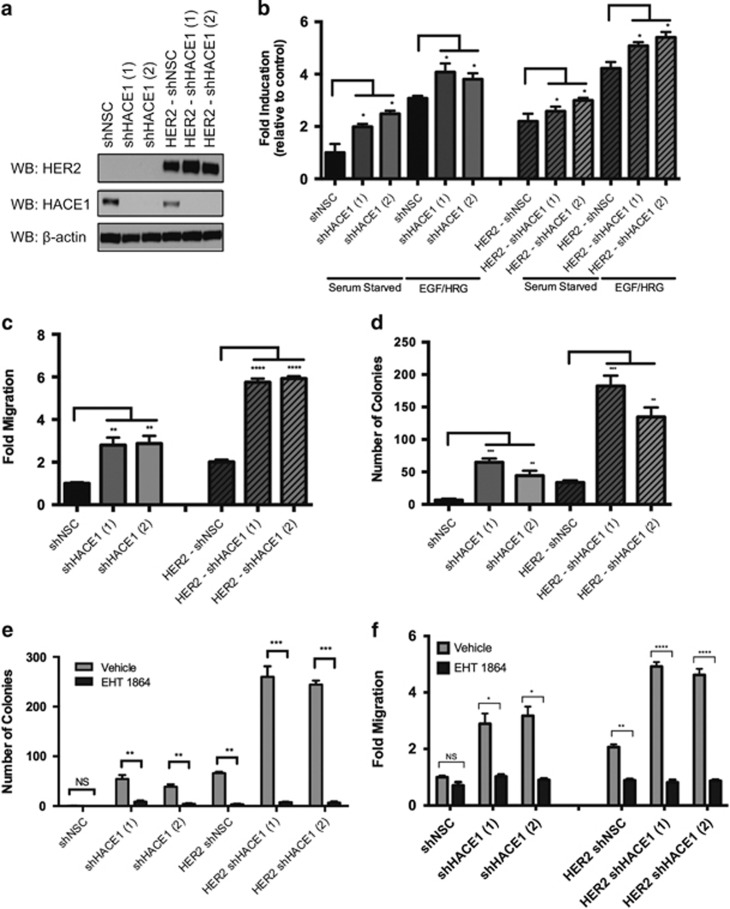
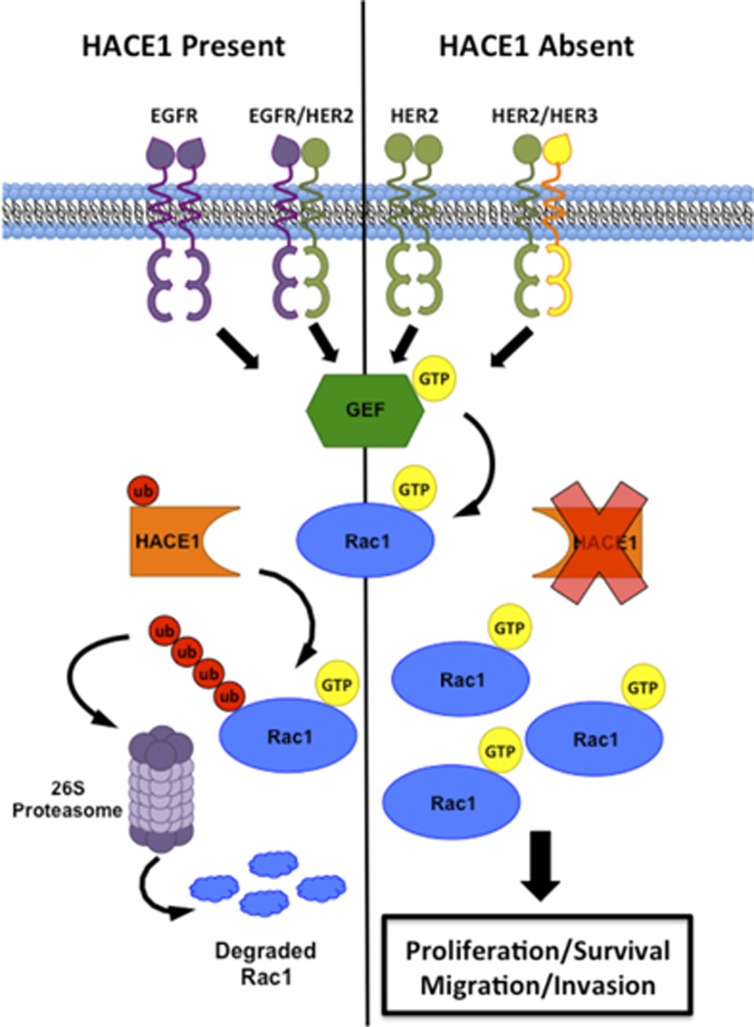
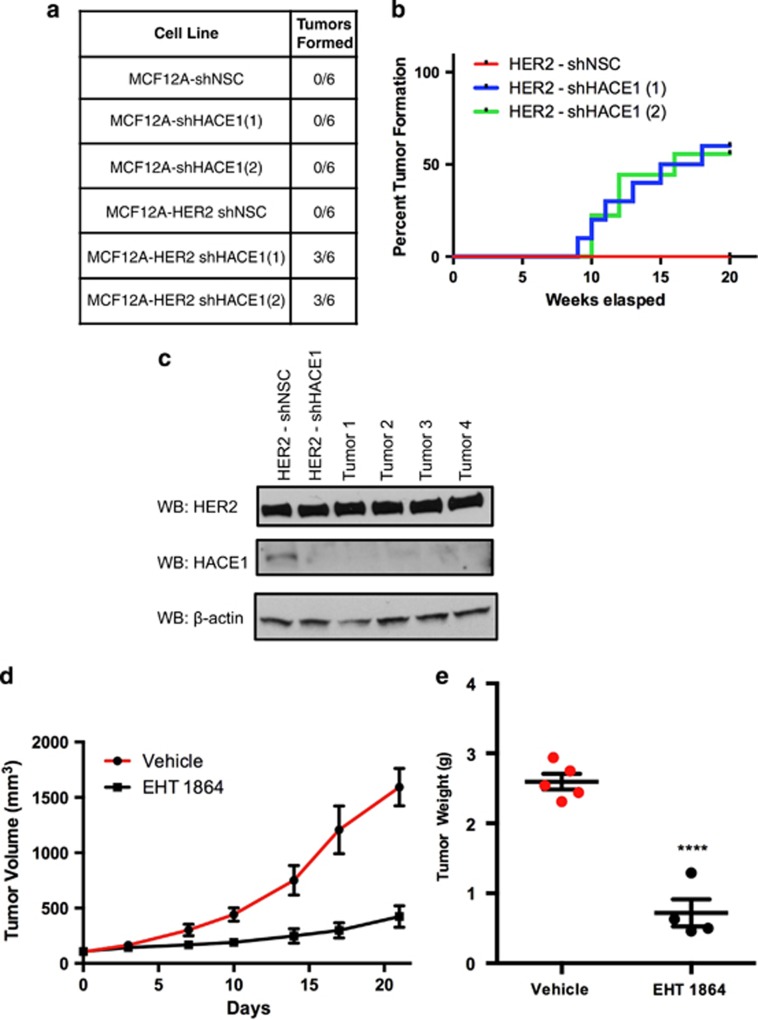
The transition from ductal carcinoma in situ (DCIS) to invasive breast cancer (IBC) is a crucial step in breast cancer progression. The specific alterations that govern this transition have not been elucidated. HER2/neu is frequently overexpressed in DCIS but is less common in IBC, thereby suggesting additional requirements for transformation. To identify genes capable of cooperating with HER2/neu to fully transform mammary epithelial cells, we used an insertional mutagenesis screen on cells isolated from wild-type neu expressing mice and identified the E3 ligase HACE1 as HER2 cooperative tumor suppressor gene. Loss of HACE1 expression is commonly seen in clinical breast cancer data sets. HACE1 downregulation in normal human mammary epithelial cells (HMECs) results in the accumulation of the activated GTP-bound Rac1 partially transforming these cells. Overexpression of HER2 activates Rac1, which further accumulates upon HACE1 loss resulting in Rac1 hyperactivation. Although the knockdown of HACE1 or overexpression of HER2 alone in HMECs is not sufficient for tumorigenesis, HER2 overexpression combined with HACE1 downregulation fully transforms HMECs resulting in robust tumor formation. The pharmaceutical interference of Rac function abrogates the effects of HACE1 loss both in vitro and in vivo, resulting in marked reduction in tumor burden. Our work supports a critical role for HACE1 in breast cancer progression and identifies patients that may benefit from Rac-targeted therapies.


Figures

Figure 1
Figure 1
Identification of HACE1 as a HER2/neu cooperating tumor suppressor gene. (a) VBIM soft agar screen design. (b) Typical colony formed in soft agar. Bright-field and green fluorescent protein (GFP) filter images taken at × 10 magnification. (c) Mapping of viral integration site of clone 1.10 to murine HACE1 Exon22. (d) RT–PCR for HACE1 on cDNA from parental mouse mammary tumor virus-neu mouse mammary epithelial cells and clone SD1.10. (**P< 0.001 between groups, Student's t-test).
Figure 2
Figure 2
Reduced HACE1 expression in breast cancer data sets. (a) mRNA expression analysis for human HACE1 on normal breast and HER2+ invasive ductal breast carcinoma in TCGA breast data set graphed as log2 median-centered ratio. (b) mRNA expression analysis for human HACE1 on normal breast and invasive ductal breast carcinoma in TCGA breast data set graphed as log2 median-centered ratio. (c) HACE1 DNA copy number for blood, normal breast and invasive ductal breast carcinoma in TCGA breast data set graphed as log2 copy number units. Statistical analyses between normal breast and invasive ductal breast carcinoma were conducted using a Student's t-test between groups.
Figure 3
Figure 3
HACE1 controls transformation through regulation of Rac1. (a) HACE1 expression in MCF12A cells after treatment with two independent HACE1-specific shRNAs (shHACE1, 1 and 2) as determined by western blotting. Non-silencing control (NSC) shRNA is shown as control. (b) Colony formation of MCF12A shHACE1 (1 and 3) and shNSC cells. Data are expressed as mean±s.e.m. of three separate experiments. (c) Rac-GTP levels in MCF7 HACE1 overexpressing and GFP control cells stimulated with EGF and HRG as determined by Rac-GTP pull-down. (d) Immunoblots show Rac1 ubiquitylation in HRG- and EGF-stimulated MCF7 cells expressing GFP control cells, HACE1 and HACE1 C876S cells. Ub cross-linked forms of Rac1 were purified (Ub-enrichment), resolved on 10% SDS–PAGE and detected by immunoblot for Rac1. (e) Immunoblots shows Rac1 ubiquitylation in HRG- and EGF-stimulated MCF7 cells expressing GFP control, HACE1, HA-Rac1 and HA-Rac1K147R. Ubiquitylated HA-Rac was enriched by pull-down, resolved by SDS–PAGE and detected by immunoblot for Ubiquitin. (f) Colony formation of MCF7 GFP control cells and MCF7 HACE1 cells. Data are expressed as mean±s.e.m. of three separate experiments. (g) Rac1-GTP levels in MCF12A shHACE1 (1 and 2) knockdown and shNSC cells as determined by Rac1-GTP pull-down. Cells were stimulated for 30 min with 100 ng/ml EGF and 10 ng/ml HRG after overnight starvation. (h) Rac1 fold activation of MCF12A shHACE1 (1 and 2) and shNSC cells as determined by Rac1 G-LISA. Cells were stimulated for 30 min with 100 ng/ml EGF and 10 ng/ml HRG after overnight starvation. Data from triplicates (fold increase relative to NSC in the absence of stimuli) are presented as mean±s.e.m. of three independent experiments. (i) Migration (Boyden chamber) and (j) invasion (modified Boyden chamber) of MCF12A shHACE1 (1 and 2) and shNSC cells (20 h). A quantity of 100 ng/ml EGF and 10 ng/ml HRG was used as chemoattractant between groups, Student's t-test). Data are expressed as mean±s.e.m. of three separate experiments. (*P<0.01, **P<0.001, ***P<0.0001 between groups, Student's t-test).
Figure 4
Figure 4
Rac inhibition reverses phenotypic effects of HACE1 loss. (a) Rac1-GTP levels in MCF12A shHACE1 (1 and 2) knockdown and MCF12A shNSC cells as determined by Rac1-GTP pull-down. Cells were stimulated for 30 min with 100 ng/ml EGF and 10 ng/ml HRG in the presence of 25 μM EHT1864 or vehicle after overnight serum starvation. (b) Soft agar colony formation of MCF12A shHACE1 (1 and 2) and MCF12A shNSC cells in the presence of 50 μM EHT1864 or vehicle (**P<0.001 between groups, Student's t-test). Data are expressed as mean±s.e.m. of three separate experiments. (c) In vitro migration (20 h) of MCF12A shHACE1 (1 and 2) and MCF12A shNSC cells as determined by Boyden chamber in the presence of 25 μM EHT1864 or vehicle. A quantity of 100 ng/ml EGF and 10 ng/ml HRG was used chemoattractant (*P<0.01 between groups, Student's t-test). Data are expressed as mean±s.e.m. of three separate experiments.
Figure 5
Figure 5
HER2 cooperates with HACE1 to enhance Rac-mediated transformation. (a) HACE1 expression in MCF12A cells and MCF12A-HER2 cells after treatment with two independent HACE1-specific shRNAs (shHACE1 (1 and 2) as determined by western blot analysis. Non-silencing control (NSC) shRNA is shown as a control. (b) Rac1 fold activation of MCF12A shHACE1 (1 and 2), shNSC, HER2 shHACE1 (1 and 2) and HER2 shNSC cells as determined by Rac1 G-LISA. Cells were stimulated for 30 min with 100 ng/ml EGF and 10 ng/ml HRG after overnight starvation. Data from triplicates (fold increase relative to NSC in the absence of stimuli) are presented as mean±s.e.m. of three independent experiments. (c) Migration (20 h) of MCF12A shHACE1 (1 and 2), shNSC, HER2 shHACE1 (1 and 2) and HER2 shNSC cells. A quantity of 100 ng/ml EGF and 10 ng/ml HRG was used as chemoattractant. Data are expressed as mean±s.e.m. of three separate experiments. (d) Soft agar colony formation of MCF12A shHACE1 (1 and 2), shNSC, HER2 shHACE1 (1 and 2) and HER2 shNSC cells. Data are expressed as mean±s.e.m. of three separate experiments. (e) Colony formation of MCF12A shHACE1 (1 and 2), shNSC, HER2 shHACE1 (1 and 2) and HER2 shNSC cells in the presence of 50 μM EHT1864 or vehicle. Data are expressed as mean±s.e.m. of three separate experiments. (f) Migration (20 h) of MCF12A shHACE1 (1 and 2), shNSC, HER2 shHACE1 (1 and 2) and HER2 shNSC cells in the presence of 25 μM EHT1864 or vehicle. A quantity of 100 ng/ml EGF and 10 ng/ml HRG was used as chemoattractant. Data are expressed as mean±s.e.m. of three separate experiments. (*P<0.01, **P<0.001, ***P<0.0001, ****P<0.00001 between groups, Student's t-test).
Figure 6
Figure 6
Schematic overview of HACE1 loss in breast cancer. The overexpression of HER2 results in Rac1 activation by homo- or hetero-dimerization of HER family members. Ubiquitylation of Rac1 occurs upon activation when HACE1 is present and Rac1 is degraded via the 26 S proteasome. When HACE1 is lost, activated Rac1 accumulated in the cell driving proliferation, cell survival, migration and invasion.
Figure 7
Figure 7
HER2 cooperates with HACE1 allowing full malignant transformation. (a) In vivo tumor formation of MCF12A shHACE1 (1 and 2), MCF12A shNSC, MCF12A-HER2 shHACE1 (1 and 2) and MCF12A-HER2 shNSC cells. Cells were injected into NOD/SCID mice and allowed to grow for 30 weeks; n=6 per group. (b) Time course of In vivo tumor formation of MCF12A-HER2 shHACE1 (1 and 2) and MCF12A-HER2 shNSC cells. Cells were injected into NOD/SCID mice and allowed to grow for 20 weeks; n=10 per group. (c) Western blot analysis of MCF12A-HER2 shNSC and shHACE1 cell lines and primary tumors (d) MCF12A-HER2 shHACE1 tumor volumes from mice treated with intraperitoneal injections of 30 mg/kg EHT1864 or vehicle. Graphs show mean±s.e.m. of tumor volume at indicated days. n=4 or 5 mice per group. (d) Graph shows tumor weight after 21 days of vehicle or EHT1864 treatment of MCF12A-HER2 shHACE1 tumors (****P<0.00001 between groups, Student's t-test). Graphs show mean±s.e.m. of tumor weight; n=4 or 5 mice per group.

References

    1. 1Wood LD, Parsons DW, Jones S, Lin J, Sjoblom T, Leary RJ et al. The genomic landscapes of human breast and colorectal cancers. Science 2007; 318: 1108–1113. - PubMed
    1. 2Jones PA, Baylin SB. The epigenomics of cancer. Cell 2007; 128: 683–692. - PMC - PubMed
    1. 3Roses RE, Paulson EC, Sharma A, Schueller JE, Nisenbaum H, Weinstein S et al. HER-2/neu overexpression as a predictor for the transition from in situ to invasive breast cancer. Cancer Epidemiol Biomarkers Prev 2009; 18: 1386–1389. - PMC - PubMed
    1. 4Latta EK, Tjan S, Parkes RK, O'Malley FP. The role of HER2/neu overexpression/amplification in the progression of ductal carcinoma in situ to invasive carcinoma of the breast. Mod Pathol 2002; 15: 1318–1325. - PubMed
    1. 5Guy CT, Webster MA, Schaller M, Parsons TJ, Cardiff RD, Muller WJ. Expression of the neu protooncogene in the mammary epithelium of transgenic mice induces metastatic disease. Proc Natl Acad Sci USA 1992; 89: 10578–10582. - PMC - PubMed