Review
. 2015 Mar 11;115(5):2045-108.
doi: 10.1021/cr500279h. Epub 2015 Feb 9.

Electrochemistry of nonconjugated proteins and glycoproteins. Toward sensors for biomedicine and glycomics

Affiliations
Review

Electrochemistry of nonconjugated proteins and glycoproteins. Toward sensors for biomedicine and glycomics

Emil Paleček et al. Chem Rev. .
No abstract available


Figures

Figure 1
Figure 1
Polarographic catalytic waves of human serum. (1) Pure supporting electrolyte, 0.1 M ammonia/ammonium chloride buffer; (2) the “presodium” catalytic wave, 400-times diluted human serum (A) in 0.1 M ammonia/ammonium chloride; (3) two-step reduction of Co(III), 1 mM Co(NH3)6Cl3 in 0.1 M ammonia/ammonium chloride; (4) the catalytic double-wave in Brdička solution, 1 mM Co(NH3)6Cl3 + 400-times diluted human serum (A′) in 0.1 M ammonia/ammonium chloride; recorded from 0 V vs mercury pool, 200 mV/abscissa. Adapted with permission from ref (64). Copyright 1933 Collection of Czechoslovak Chemical Communications.
Figure 2
Figure 2
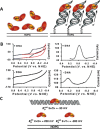
(A) Schematic representation of electrochemistry for endonuclease III (Endo III) on highly oriented pyrolytic graphite electrode (HOPGE) with and without modification with DNA. (B) Cyclic (left, 50 mV/s scan rate) and square wave voltammograms (right, 15 Hz) of 50 μM Endo III in 20 mM Na phosphate, 100 mM NaCl, 1 mM EDTA, 20% glycerol, pH 7.5. The top two panels show electrochemical responses of Endo III at a HOPGE modified with the sequence pyrene-(CH2)4-Pi-5′-AGT ACA GTC ATC GCG-3′ plus complement. Cyclic voltammograms of a HOPGE modified with DNA featuring an abasic site are in red (top left), where the abasic position corresponds to the complement of the italicized base. The bottom two panels show electrochemical responses of Endo III on a bare HOPGE. All runs were taken using the inverted drop cell electrode configuration vs Ag/AgCl reference and Pt auxiliary electrode. (C) Illustration of the potentials vs normal hydrogen electrode (NHE) of the couples of Endo III in the presence and absence of DNA. These values are obtained from SWV on a HOPGE and are averages of at least four trials each. Adapted with permission from ref (143). Copyright 2006 American Chemical Society.
Figure 3
Figure 3
Schemes of EC oxidation of tyrosine (Tyr) and tryptophan (Trp). Adapted with permission from ref (164). Copyright 2013 Wiley-VCH Verlag GmbH&Co.
Figure 4
Figure 4
(A) Oxidation of Trp- and Tyr-containing peptides on carbon paste electrodes. (a) Differential pulse voltammograms and (b) chronopotentiograms for (A1) Tyr- and Trp-containing luteinizing hormone releasing hormone, (A2) Tyr-containing neurotensin, and (A3) Trp-containing bombesin. 10 nM peptide was adsorbed for 5 min at accumulation potential of 0.1 V followed by chronopotentiogram or DP voltammogram recording. CPS: Istr 5 μA; DPV scan rate, 5 mV/s. Y refers to Tyr and W to Trp residues. Adapted with permission from ref (159). Copyright 1996 Elsevier. (B) Oxidation peak of 2 μM human serum albumin (HSA) denatured in 8 M urea at glassy carbon electrode. (C) Dependences of square wave voltametric peak heights (−■−) and changes in fluorescence emission at 334 nm (− –○– −) on urea concentration. 1 μM HSA was incubated overnight with different urea concentrations (indicated in the figure) at 4 °C. Oxidation peak height of HSA denatured in 8 M urea was taken as 1. In the fluorescence measurements, intensity at 334 nm produced by 1 μM HSA incubated in the absence of urea was taken as 1. Adapted with permission from ref (218). Copyright 2012 Elsevier.
Figure 5
Figure 5
(A) Oxidation of tyrosine (Tyr) with signal enhancement. ITO, indium tin oxide electrode; Bipy, 2,2′-bipyridine; dppz, dipyrido [3,2-a:20,30-c] phenazine. (B) Cyclic voltammograms of (a) 5 μM Os(bpy)2dppz, (b) 2 mM Tyr, and (c) 5 μM Os(bpy)2dppz and 2 mM Tyr. Working electrode: ITO. Reference: Ag/AgCl/3 M KCl. Supporting electrolyte: 100 mM sodium phosphate, pH 7.3. Scan rate: 30 mV/s. Adapted with permission from ref (185) Copyright 2012 Elsevier.
Figure 6
Figure 6
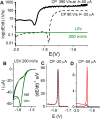
(A) Schematic representation of the rate of potential changes in chronopotentiometry (CP) at two different intensities as compared to voltammetry. In linear sweep voltammetry (LSV), the scan rate (chosen by an experimenter) is constant throughout the whole voltammogram recording. However, in CP the rate of potential changes is influenced by the current density. At constant electrode size, this density is determined by polarizing current intensity (I, chosen by an experimenter). In the absence of the electrode process, the potential changes very rapidly (e.g., 390 V/s at I = −50 μA), but it gets much slower in a narrow potential range where the electrode process (e.g., proton reduction and hydrogen evolution) is taking place. (B–D) In protein analysis, both native (nat, black) and denatured (den, green or red) proteins are firmly attached to the Hg electrode surface, and prolonged exposure of native folded protein to negative potentials (at low scan rates or I intensities) may result in its denaturation, indicated by almost the same (B) LSV or (C) CP responses. (D) At high current intensity in CP, for example, at I = −50 μA, fast potential changes (390 V/s) prevent protein from the denaturation at the negatively charged electrode surface, as indicated by a relatively small CP response of native (black) protein and a very large response of the denatured (red) protein.
Figure 7
Figure 7
(A) CPS peaks H of 1 μM angiotensin peptides (AT) in McIlvaine buffer, pH 7 at HMDE; dotted line represents blank background electrolyte. Inset: CPS peak H of hexaArg and hexaHis. (B) Amino acids sequences of AT peptides. Adapted with permission from ref (170). Copyright 2013 Elsevier.
Figure 8
Figure 8
(A) Dependence of peak height of 100 nM native (black) and denatured (blue) BSA on concentration of sodium phosphate, pH 7 in the presence of 56 mM urea (black). Accumulation time tA of 60 s, accumulation potential EA of −0.1 V, stirring 1500 rpm, stripping current, Istr, of −30 μA. (B) Column graph showing peak H heights of native (stripped column) and denatured (black column) BSA obtained in AdT (ex situ) stripping experiment. 100 nM BSA was adsorbed at HMDE for tA of 60 s at EA of −0.1 V either from 50 mM or from 200 mM sodium phosphate, pH 7, and the BSA-modified electrode was transferred to the electrolytic cell with blank 50 or 200 mM sodium phosphate, pH 7, to record the chronopotentiogram. 50 → 200 indicates BSA adsorption from 50 mM phosphate, followed by a transfer of BSA-modified electrode to 200 mM phosphate in the electrolytic cell. Denaturation of 14.4 μM BSA in 0.1 M Tris-HCl, pH 7.3, with 8 M urea was performed overnight at 4 °C. The protein solution was then diluted by the background electrolyte to the final protein concentration (usually about 100 nM and immediately measured). Reprinted with permission from ref (232). Copyright 2009 Royal Society of Chemistry.
Figure 9
Figure 9
Schematic representation of the effect of the stripping current intensity (Istr) on peaks H of native and denatured proteins. The scheme demonstrates that at low Istr intensities, the surface-attached protein is denatured, producing almost the same peak H as the protein, which was denatured in solution by a chemical denaturation agent. The protein denaturation at the electrode surface is due to the prolonged effect of the electric field at negative potentials. At higher Istr intensities, the time of exposure of the protein to negative potentials is much shorter, causing a little harm to the surface-attached protein as manifested by a relatively small peak H.
Figure 10
Figure 10
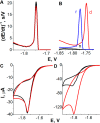
Constant current chronopotentiometric stripping (CPS) peak H of 100 nM native BSA (n, black), DTT-reduced BSA (r, blue), and guanidinium chloride (GdmCl)-denatured BSA (d, red) (A) at bare and (B) at DTT-modified HMDE (DTT-HMDE) in McIlvaine buffer, pH 7. GdmCl was present in all samples at nondenaturing (70 mM) concentration; conventional CPS measurements using stripping current, Istr, −70 μA. (C, D) Adsorptive transfer stripping cyclic voltammograms of native (black) and denatured BSA (red) at DTT-modified HMDE at scan rates of (C) 50 mV/s and (D) 1 V/s. In this experiment, 1 μM BSA was adsorbed at DTT-HMDE from McIlvaine buffer, pH 7, for tA 60 s. The adsorptive transfer procedure was applied to prevent additional BSA adsorption during the potential scanning. BSA was denatured with 6 M GdmCl. Adapted with permission from ref (239). Copyright 2010 American Chemical Society.
Figure 11
Figure 11
(A) Chronopotentiograms of 100 nM native BSA coadsorbed with 60 μM DTT at HMDE. (B) Dependence of peak H and peak S heights obtained with BSA·DTT-HMDE on concentration of DTT. BSA·DTT-HMDE was prepared by coadsorption of 100 nM BSA and 1 mM DTT at HMDE followed by CPS peak H recording at stripping current, Istr, −70 μA. Adapted with permission from ref (228). Copyright 2013 Elsevier.
Figure 12
Figure 12
CPS responses of the native and denatured proteins at bare and DTT-modified mercury electrodes. (A) Dependence of CPS peak H area of 20 nM native (−●–, − –○– −) and denatured (−■–, − –□– −) urease on stripping current, Istr, at bare (solid line) and DTT-modified (dashed) HMDEs. Urease was adsorbed at accumulation potential of −0.1 V for accumulation time, tA, of 60 s from McIlvaine buffer, pH 7, with 26 mM GdmCl in a thermostated electrolytic cell at 25 °C, and CPS analysis proceeded at the given Istr. (B,C) Chronopotentiograms of 20 nM native (black) and denatured urease (red) on a bare HMDE at (B) different striping currents at 25 °C and (C) different temperatures using Istr −25 μA. Adapted with permission from ref (238). Copyright 2013 Elsevier.
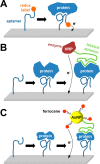
Figure 13
Figure 13
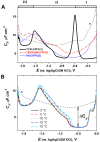
(A) Capacity–potential curves of 1 μM peptide YYKLVFFC (black), YEVHHQKLVFF (red), and KKLVFFA (blue) in 35 mM Na-phosphate, pH 7 (dashed line). Peptides were adsorbed at −0.1 V, for tA of 120 s at HMDE, followed by recording of ac voltammogram with a frequency of 150 Hz, amplitude of 5.0 mV, and a scan rate of 8.0 mV/s. (B) Capacity–potential curves of 1 μM peptide YYKLVFFC recorded in 35 mM phosphate buffer, pH 7.0 at different temperatures, as indicated on the graph. Accumulation potential EA of −0.5 V; accumulation time tA of 120 s. Adapted with permission from ref (221). Copyright 2013 Elsevier.
Figure 14
Figure 14
Structure of DNA-binding domain of p53. (A) Overall structure of T-p53C (PDB entry 1UOL). Sites of cancer mutations investigated in this study (V143A, R175H, F270L, and R273H) are highlighted as green stick models. (B) Close-up view of the zinc coordination sphere, with the four zinc ligands shown in magenta. (C–F) CPS peak H of wild type T-p53C (black) and mutant R175H (red) at DTT-HMDE in 50 mM phosphate, pH 7 at (C) 11.1 °C, (D) 13.9 °C, (E) 15.9 °C, and (F) 20.3 °C. (G–J) CPS peaks H of (G) wt, (H) R175H, (I) R273H, and (J) V143A treated by 0 mM (red), 5 mM (blue), 10 mM (green), and 20 mM (cyan) EDTA at 0 °C for 10 min. CPS measurements were performed at 18 °C. Adapted with permission from ref (105). Copyright 2011 American Chemical Society.
Figure 15
Figure 15
Chronopotentiograms of (A) Na+/K+-ATPase (NKA) and (B) its C45 loop. CPS experiment at HMDE, concentration of proteins: (A) 10 μM and (B) 500 nM, tA of 30 s; supporting electrolyte, Britton–Robinson buffer, pH 6.5; stripping current Istr, −10 μA. (C) CPS records of 5 μM C45 loop before (black) and after (red) incubation with cisplatin. (D) Dependence of peak heights (C45 peak S, C45 peak H2, and cis-Pt) on the concentration of cisplatin. Concentration of cisplatin (for C) was 40 μM, activated complex was used for all experiments. EC parameters: supporting electrolyte 0.2 M phosphate buffer, pH 7.4; tA of 30 s, Istr of −20 μA. “*” in inset of panel A: NKA transmembrane part. Adapted with permission from refs (410) and (412). Copyright 2012 Wiley-VCH Verlag GmbH&Co and 2012 Elsevier.
Figure 16
Figure 16
Different DNA–protein binding modes. (A) Most proteins insert helix element into the major groove of DNA molecule. For example, helical bZIP motif of the AP-1 transcription factor binds within the major groove of the specific DNA sequence (PDB: 1FOS). (B) Some proteins employ, however, β-sheets for their binding into the minor groove of DNA. For example, TBP protein binds to minor groove and partially unwinds and kinks DNA (PDB: 1YTB).
Figure 17
Figure 17
Model for a DNA-mediated search by repair proteins. (1) When the cell undergoes oxidative stress, guanine radicals are formed, triggering a repair protein to bind DNA. (2) DNA-binding protein is oxidized, releasing an electron that repairs the guanine radical. (3) Another repair protein binds to a distant site. As it binds to DNA, there is a shift in the redox potential of the protein, making it more easily oxidized. (4) The protein could then send an electron through the DNA base pair stack that travels to a distally bound protein, scanning the intervening region for damage. (5) If the base pair stack is intact, charge transport occurs between proteins. The repair protein that receives the electron is reduced and dissociates. (6) If a lesion is present (red), charge transport is attenuated, and the repair proteins will remain bound in the oxidized form and slowly proceed to the site of damage. Adapted with permission from ref (464). Copyright 2012 American Chemical Society.
Figure 18
Figure 18
Electrochemical platform (right) and scheme (left) for the detection of human methyltransferase activity from crude cell lysates. (right) The electrochemical detection platform contains two electrode arrays, each with 15 electrodes (1 mm diameter each) in a 5 × 3 array. Multiple DNAs are patterned covalently to the substrate electrode by an electrochemically activated click reaction initiated with the patterning electrode array. Once a DNA array is established on the substrate electrode platform, electrocatalytic detection is then performed from the top patterning/detection electrode. (left) Overview of electrochemical detection scheme at each electrode of the 5 × 3 array. DNA, patterned onto the bottom electrode using the copper-activated click chemistry, is electrocatalytically detected from the top electrode using methylene blue (MB+) as the electrocatalyst and ferricyanide for amplification. Crude cell lysate is then added to the surface containing the patterned DNA. If methyltransferase (green) is present (blue arrows), the hemimethylated DNA on the electrode is methylated (green dot) by the methyltransferase to a fully methylated duplex; if methyltransferase is not present (red arrows), the hemimethylated DNA is not further methylated. A methylation-specific restriction enzyme, BssHII (purple), is then added. If the DNA is fully methylated (blue arrows), the electrochemical signal remains protected, and the DNA is not cleaved. However, if the DNA remains hemimethylated (red arrows), it is cut by the restriction enzyme, and the electrocatalytic signal associated with MB+ binding to DNA is diminished significantly. Adapted with permission from ref (479). Copyright 2014 Proceedings of the National Academy of Sciences of the United States of America.
Figure 19
Figure 19
(A) Impedance spectra of a gold electrode with NF-κB-specific dsDNA before (a) and after (b) incubation with 33 μg/mL NF-κB p50, as measured by Tersch and Lisdat. (B) Nyquist plots of gold electrode modified with DNA duplexes before and after interaction with BSA and TBP, as reported by Chang and Li. Electrolyte: 10 mM PBS (pH 7.0) with 10 mM [Fe(CN)6]3–/4– and 10 mM NaCl. Frequency: from 0.1 Hz to 100 k Hz. Amplitude: 10 mV. Bias potential: 0.20 V. Adapted with permission from refs (485) and (484). Copyright 2011 and 2009 Elsevier.
Figure 20
Figure 20
(A) Sequence-specific binding of wild-type p53 core domain (p53CD) to dsDNACON as detected by CPS at a DTT-modified hanging mercury drop electrode (DTT-HMDE) using Istr −35 μA at 21 °C. Free p53CD (black), sequence-specific p53CD–DNACON complex (red), and a mixture of p53CD with 40-mer dsDNA not containing the consensus sequence (blue, p53CD + dsDNANON). (B) Interaction of mutant p53CD R273H with dsDNACON (showing no DNA binding). Free p53CD R273H (black), p53CD R273H + dsDNACON (red), p53CD R273H + dsDNANON (blue). (C) Peak H of p53CD (black) and p53CD complexes with spacer-containing DNAs: DNACON–GC (green), DNACON–AT (blue), and DNACON–ATAT (magenta); Istr −35 μA at 21 °C. (D–F) Peak H of p53CD (black), p53CD–DNACON complex (red), and p53CD–DNANON (blue) at Istr of (D) −25 μA, (E) −40 μA, and (F) −50 μA. (G) Dependence of peak H1 height of free p53CD (black), p53CD–DNACON complex (red), and p53CD–DNANON (blue) on stripping current (−Istr). Adapted with permission from ref (240). Copyright 2014 Elsevier.
Figure 21
Figure 21
Graphical representation of complexity of glycans, showing variability of sugar building blocks, multiple branching, and attachment points. Adapted with permission from ref (37). Copyright 2013 Springer Science and Business Media.
Figure 22
Figure 22
Enzymatic release of whole glycans or carbohydrates from glycoproteins. Abbreviation of enzymes: endo-β-GlcNAc-ase, endo-β-N-acetylglucosaminidase (endo H); PNGase F, peptide:N-glycosidase F (PNGase F); α-Man-ase, α-mannosidase; β-Man-ase, β-mannosidase; NANA-ase, N-acetylneuraminic acid hydrolase (sialidase); β-Gal-ase, β-galactosidase; and β-HexNac-ase, β-N-acetylhexosaaminidase.
Figure 23
Figure 23
Schematic representation of EC detection of cells with lectins by monitoring of respiratory activity of the cells with a two-mediator system.
Figure 24
Figure 24
Probing the specific sugar–lectin interactions on surface modified by (a,c) glucose and (b,d) galactose. The interaction between lectin and immobilized saccharide was detected by either (a,b) DPV or (c,d) EIS. Bare screen printed electrode was modified by graphene oxide (GO), then by antraquinone containing glucose (GO-GA1) or galactose (GO-GA2), and interaction between saccharide-containing surfaces was probed by two lectins: Con A, recognizing glucose; and peanut agglutinin, recognizing galactose. All experiments were performed in Tris-HCl (pH 7.0). Adapted with permission from ref (634). Copyright 2013 Macmillan Publishers Ltd.: Scientific Reports.
Figure 25
Figure 25
Various ways to prepare modified lectins with improved binding properties. (A) Modification of a lectin by a biotin derivative, which upon incubation with a dye-labeled streptavidin forms a lectin multimer. Adapted with permission from ref (637). Copyright 2013 American Chemical Society. (B) A redox switchable formation of a lectin dimer involving a thiolated form of a lectin. Adapted with permission from ref (638). Copyright 2004 John Wiley & Sons. (C) A scheme of increased strength of interaction between BAD (boronic acid-decorated) lectin and a glycan with involvement of lectin binding site and boronate derivative in the biorecognition. Adapted with permission from ref (639). Copyright 2013 American Chemical Society.
Figure 26
Figure 26
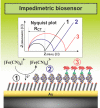
A typical interfacial layer of the EIS-based biosensor after SAM formation (1), immobilization of lectins (2), and biorecognition of a glycoprotein (3) with corresponding Nyquist plots showing shifts in the RCT value with an increased loading of the surface.
Figure 27
Figure 27
AFM images of the gold surfaces during a patterning procedure starting with the bare gold (upper left), the gold surface modified by a mixed SAM (upper right), the surface with covalently attached SNA I lectin (lower left), and the surface after being treated with a blocking agent (lower right). Scale of z-axis was adjusted in a way to clearly see topological features on the surface after each modification step. Adapted with permission from ref (653). Copyright 2013 Springer Science and Business Media.
Figure 28
Figure 28
A graphical representation drawn to scale of interfaces applied to build (A) the 3D biosensor based on integrated 20 nm gold nanoparticles or (B) the 2D biosensor (upper image). The 3D biosensor was built on a planar gold surface by chemisorptions of 11-aminoundecanethiol for attachment of 20 nm gold nanoparticles (spheres). (A) On every gold nanoparticle, a mixed SAM composed of 11-mercaptoundecanoic acid (MUA) and 6-mercaptohexanol was formed for covalent immobilization of lectin. (B) The 2D biosensor was formed by incubation of a planar gold with MUA and mercaptohexanol for covalent attachment of a lectin. In the lower part of the figure, comparison of the response of the 2D and the 3D biosensor to its analyte fetuin (Fet) with concentration close to the LOD, represented in a Nyquist plot (left), and calibration graphs for detection of fetuin (Fet) by both biosensors (right) are shown. Adapted with permission from ref (655). Copyright 2014 Enterprise Strategy Group.
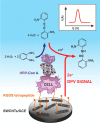
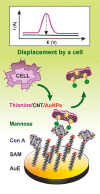
Figure 29
Figure 29
(A,B) CPS and (C) SWV curves of chitosan at mercury electrodes. (A,C) 10 μg/mL of chitosan at HMDE and (B) 15 μg/mL of chitosan at solid amalgam electrode. Accumulation time, tA, 60 s; stripping current intensity, (A) Istr, −70 μA; (B) Istr, −40 μA; (C) frequency 20 Hz; (D) CPS curves of 12 μM chitohexaose (red) and N,N′,N″,N‴,N‴′,N‴″-hexaacetylchitohexaose (blue); tA, 60 s; Istr, −40 μA. Background: 0.1 M sodium acetate, pH 5.2 (dashed). Adapted with permission from ref (246). Copyright 2014 Elsevier.
Figure 30
Figure 30
(A) Reaction of Os(VIII)L and Os(VI)L complexes with different parts of a nucleoside showing Os(VI)L complex specifically modifying ribose moiety. (B) Fragment of Os(VI)L-modified dextran. (C) Adsorptive stripping cyclic voltammograms of 10 mM base-modified (blue) and sugar-modified thymine riboside (red), and sugar-modified adenine riboside (black). (D) Dependence on pH, 10 mM sugar-modified thymine riboside, HMDE, with stirring; Britton–Robinson buffer, pH 7.0; scan rate (C) 2 V/s, (D) 1 V/s; tA of 60 s; EA of 0 V, step potential 5 mV. Adapted with permission from ref (694). Copyright 2007 John Wiley & Sons, Inc.
Figure 31
Figure 31
(A) AdTS SWV of unpurified 5 μM Os(VI)temed-treated avidin, complex avidin–biotin, and streptavidin (STV); (B) concentration dependence of peak α (EP ≈ −0.85 V) of avidin-Os(VI)temed, four replicative measurements. Inset: Detail of the concentration range 100–1000 nM. Adapted with permission from ref (702). Copyright 2014 Elsevier.
Figure 32
Figure 32
Protein kinase C-catalyzed phosphorylation of SIYRRGSRRWRKL peptide (with phosphorylated serine underlined) using ferrocene-labeled ATP (ATP-Fc) as a substrate. After a transfer of γ-phosphate-Fc group to the serine residue of the peptide, the surface-attached Fc groups are detected via EC techniques at thiol-modified gold electrodes. Adapted with permission from ref (754). Copyright 2008 Royal Society of Chemistry.
Figure 33
Figure 33
Scheme of amplification strategies for detection of protein cancer biomarkers in EC immunoassays. Surface-immobilized primary antibody (Ab1) captures an antigen, which is then detected using, for example, (a) a simple secondary antibody/enzyme (Ab2/enzyme) or (b) antibody/nanoparticle (Ab2/NP) bioconjugate, which are now often replaced with more sophisticated systems, in which the secondary antibody is coupled with, for example, (c) biotin/streptavidin/enzyme, (d) different quantum dots (Ab2/QD), (e) enzyme-modified carbon nanotubes (Ab2/CNT/multienzyme), (f) magnetic beads bearing cluster of enzymes (Ab2/MB/multienzyme), or (g) quantum dot-dendrimer nanocomposites (Ab2/dendrimer/QD).
Figure 34
Figure 34
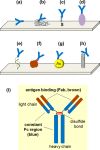
Examples of antibody immobilization to the surface. The binding can be achieved via, for example, (a) physical adsorption, (b) entrapment into a polymer matrix, (c) thiol groups, (d) protein A or G, (e) DNA-directed immobilization (by site-specific coupling of protein G to DNA oligonucleotide), (f) avidin–biotin system, (g) nanoparticle, or (h) carbon nanotubes (linked via carboxyl groups at CNT). (i) Structure of the antibody with Fab and Fc region.
Figure 35
Figure 35
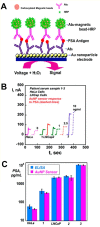
(A) Gold nanoparticle (AuNP)-based immunosensor. The immunosensor involves attached Ab1, which captures antigen from a sample, followed by incubation with Ab2-magnetic bead-HRP (Ab2-MB-HRP), providing multiple enzyme labels for each PSA bound. The detection step involves immersing the immunosensor into a buffer containing a mediator, applying voltage, and injecting H2O2. (B) Results for AuNP immunosensor incubated with PSA present in 10 μL of a calf serum (ng/mL labeled on curves, dashed lines), cell lysates (HeLa and LNCap cells), and human patient serum samples (1–3) (solid lines) for 1.25 h, followed by an injection of 10 μL of 4 pmol/mL of Ab2-MB-HRP. (C) Validation of AuNP sensor results for cell lysate and human serum samples by comparing against results from an ELISA determination (relative standard deviation ∼10%) for the same samples. Adapted with permission from ref (794). Copyright 2009 American Chemical Society.
Figure 36
Figure 36
Different approaches for detection of proteins using nucleic acid aptamers. (A) Redox-labeled aptamer alters its conformation after aptamer–protein complex formation, positioning the label closer to the electrode. (B) Strategy employing two aptamers, electrode-immobilized aptamer for capturing the protein and a second aptamer labeled with enzyme for EC monitoring of enzymatic reaction. (C) Approach similar to that in (B), with the second aptamer being labeled with gold nanoparticle–ferrocene conjugate.
Figure 37
Figure 37
Electrochemically triggered immobilization of peptide aptamers within a biochip. (a) All microelectrodes are initially protected by a mask from mPEG, resisting protein adsorption. (b) Release of a mask from the electrode #1 by a highly negative voltage. (c) Funcionalization of the electrode #1 with a peptide aptamer. (d) Independent functionalization of the whole array by various peptide aptamers by repeating steps (a)–(c). (e) Analysis of CDK2 bound to pep2, pep9, or to a reference surface covered by mPEG as change in a phase shift, ϕ(ω), which is a phase difference between an applied working potential and measured current. A typical dependence of ϕ(ω) as a function of applied frequency ω used in the analysis is shown. mPEG is a methyl-terminated polyethylene glycol containing thiol. Reprinted with permission from ref (832). Copyright 2008 BioMed Central.
Figure 38
Figure 38
Analysis of a gastric carcinoma cell line after a nonspecific attachment of cells to a RGDS peptide. In the following step, a Con A–HRP conjugate was injected to probe glycans on the cell surface. A DPV signal was acquired by analysis of a product of oxidation of o-phenylendiamine by HRP in the presence of hydrogen peroxide. Adapted with permission from ref (860). Copyright 2008 American Chemical Society.
Figure 39
Figure 39
A displacement strategy for analysis of cells. Con A was immobilized on SAM layer by covalent coupling. A thionine/carbon nanotube (CNT)/gold nanoparticles (AuNPs) nanocomposite was then incubated with the biosensor, and displacement of the nanocomposite from the surface of the Con A biosensor after incubation with cells resulted in a decrease of EC response. Adapted with permission from ref (870). Copyright 2011 Royal Society of Chemistry.
Figure 40
Figure 40
A supersandwich strategy for signal amplification in cancer cell analysis. Initially, GCE was modified by oxidized MWCNTs, dopamine, and AuNPs to which Con A was immobilized for detection of a CCRF-CEM cancerous cell line. DNA concatamer was first assembled from a capture DNA-aptamer (CDNA), a CdTe QD-labeled signal DNA (SDNA), and an auxiliary DNA (ADNA). When the cells were attached to the surface, they were probed by a preassembled concatamer, and finally a binding event was detected by an anodic stripping voltammetry of Cd2+. Adapted with permission from ref (873). Copyright 2013 American Chemical Society.

Similar articles

Cited by

References

    1. Yates J. R.; Osterman A. L. Chem. Rev. 2007, 107, 3363.
    1. Hawkins R. D.; Hon G. C.; Ren B. Nat. Rev. Genet. 2010, 11, 476. - PMC - PubMed
    1. Rabilloud T.; Chevallet M.; Luche S.; Lelong C. J. Proteomics 2010, 73, 2064. - PubMed
    1. Fang X. P.; Balgley B. M.; Lee C. S. Electrophoresis 2009, 30, 3998. - PubMed
    1. Gstaiger M.; Aebersold R. Nat. Rev. Genet. 2009, 10, 617. - PubMed

Publication types