. 2015 Feb:11:155-74.
doi: 10.1016/j.dcn.2014.12.005.

Characterizing heterogeneity in children with and without ADHD based on reward system connectivity

Affiliations

Characterizing heterogeneity in children with and without ADHD based on reward system connectivity

Taciana G Costa Dias et al. Dev Cogn Neurosci. 2015 Feb.

Abstract

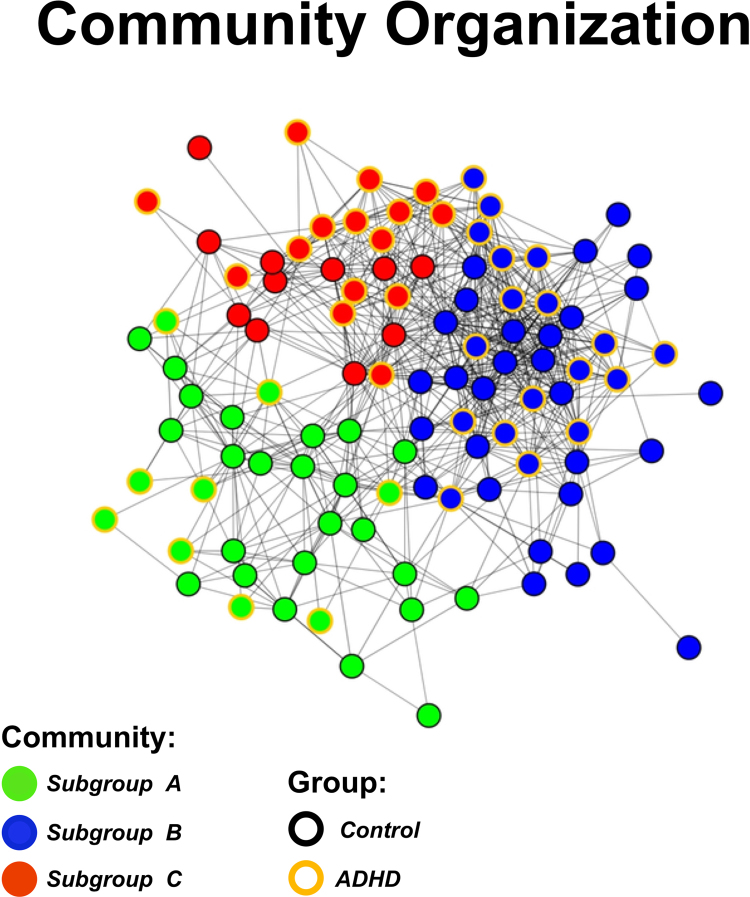
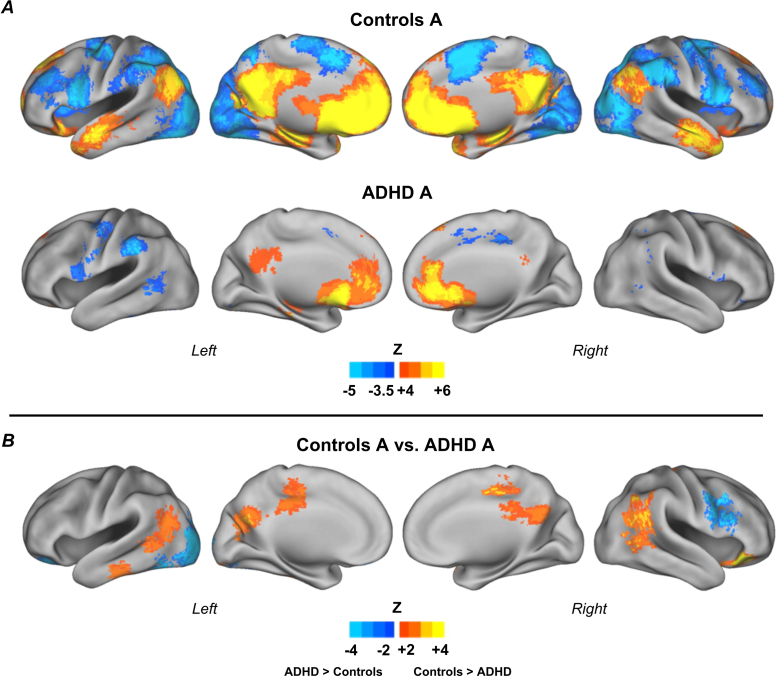
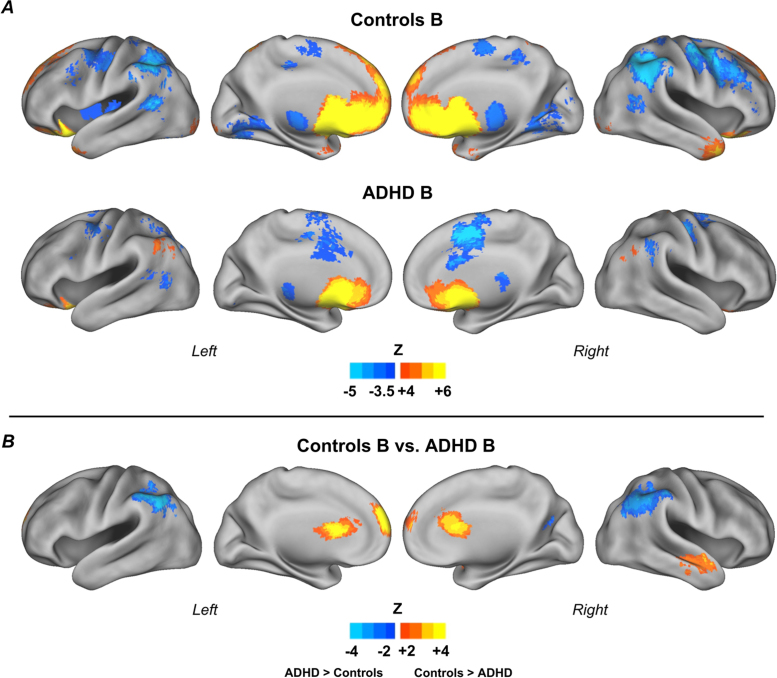
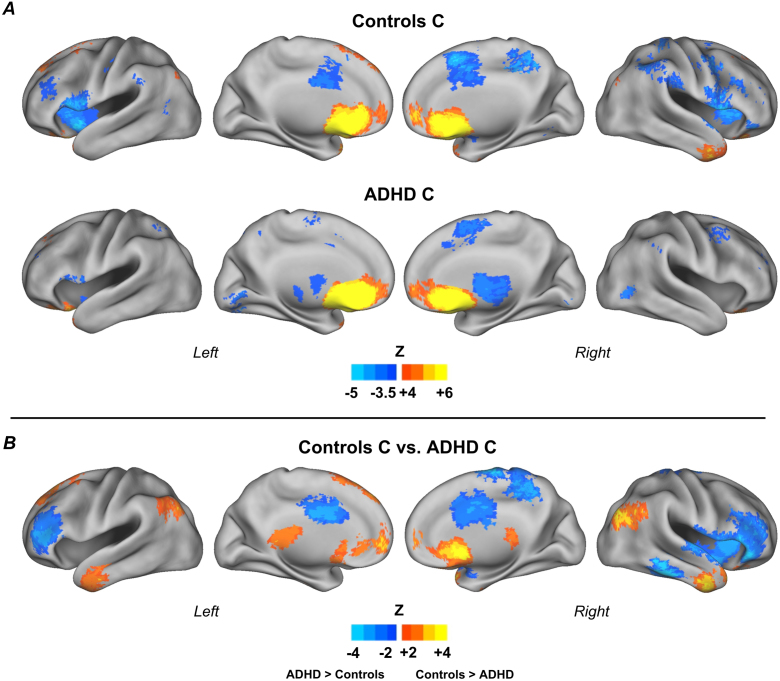
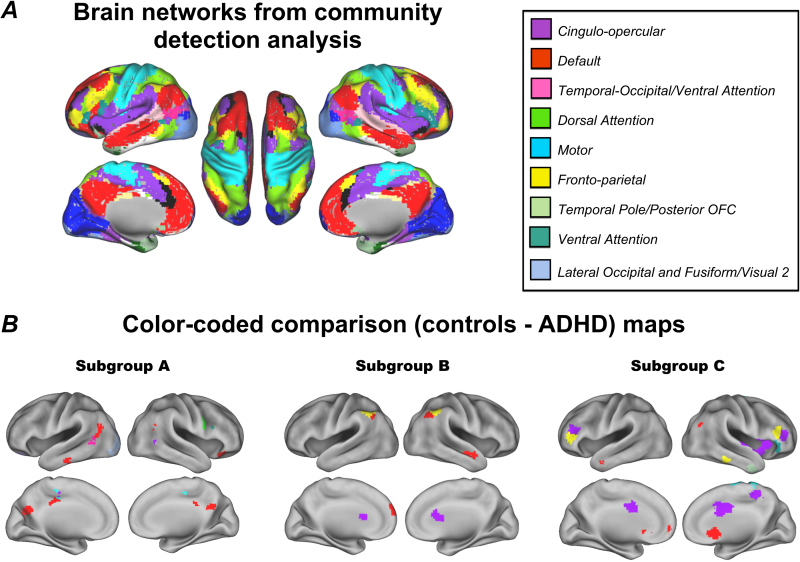
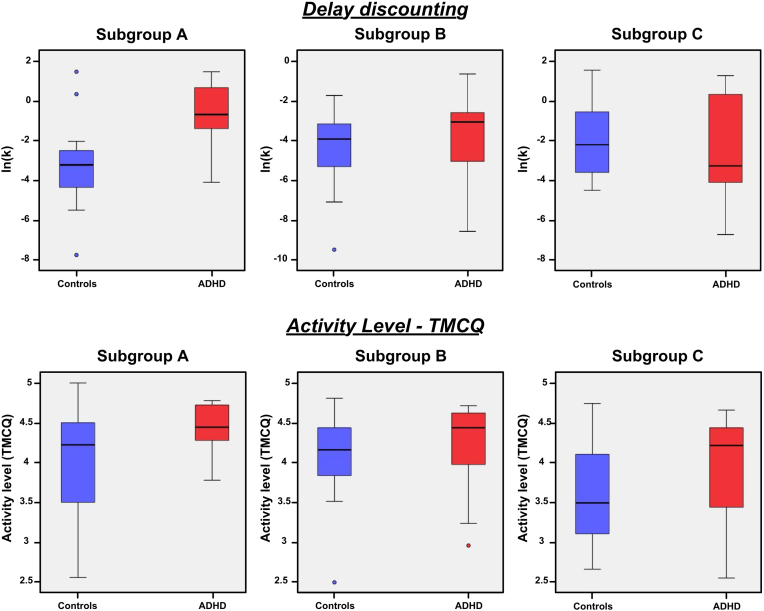
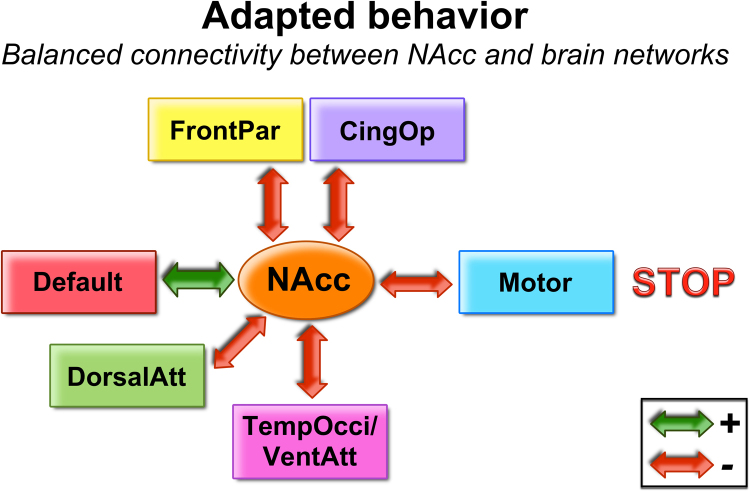
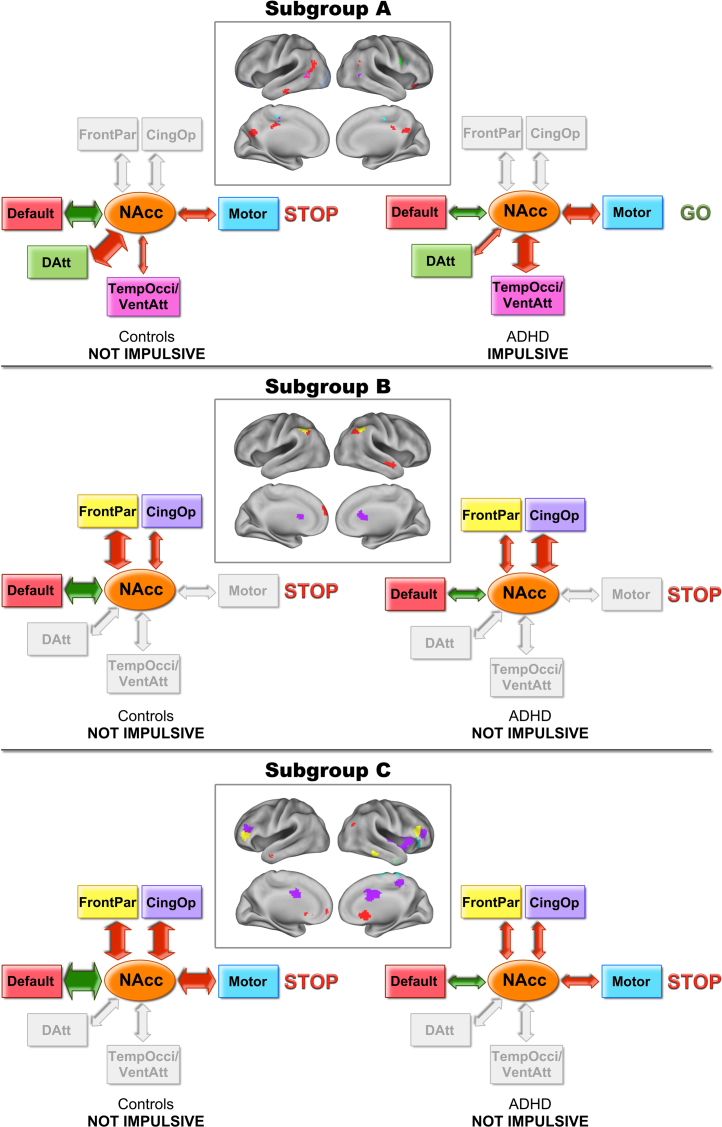
One potential obstacle limiting our ability to clarify ADHD etiology is the heterogeneity within the disorder, as well as in typical samples. In this study, we utilized a community detection approach on 106 children with and without ADHD (aged 7-12 years), in order to identify potential subgroups of participants based on the connectivity of the reward system. Children with ADHD were compared to typically developing children within each identified community, aiming to find the community-specific ADHD characteristics. Furthermore, to assess how the organization in subgroups relates to behavior, we evaluated delay-discounting gradient and impulsivity-related temperament traits within each community. We found that discrete subgroups were identified that characterized distinct connectivity profiles in the reward system. Importantly, which connections were atypical in ADHD relative to the control children were specific to the community membership. Our findings showed that children with ADHD and typically developing children could be classified into distinct subgroups according to brain functional connectivity. Results also suggested that the differentiation in "functional" subgroups is related to specific behavioral characteristics, in this case impulsivity. Thus, combining neuroimaging data and community detection might be a valuable approach to elucidate heterogeneity in ADHD etiology and examine ADHD neurobiology.

Keywords: Attention deficit hyperactivity disorder; Community detection; Delay discounting; Functional connectivity; Nucleus accumbens; RDoC.


Figures

Fig. 1
Fig. 1
Model of network underlying impulsive decision-making. Volkow et al., 2011a, Volkow et al., 2011b postulated that multiple networks interact to provide inhibitory control and decision-making. Drug addiction is associated with a disturbance of this system, which may also be involved in other types of impulsive decision-making.
Fig. 2
Fig. 2
Voxelwise resting state functional connectivity maps for the reward ROI. Results for all control children (n = 63) and all children with ADHD (n = 42) (A); and direct comparison between groups (B). Results show atypical connectivity of the reward system in children with ADHD. Monte Carlo simulation was applied to correct for multiple comparisons (Z > 2.25, p < 0.05).
Fig. 3
Fig. 3
Spring embedding representation of the community organization of the whole sample. Nodes represent subjects and are color coded by their community assignment (node cores) and their group (i.e. ADHD or control; node outlines). Green: subgroup A, blue: subgroup B, red: subgroup C. Yellow outline: ADHD, black outline: control. Connections with r ≥ 0.52 were considered connected. The network of participants was naturally organized into three communities, which are densely connected sets of participants (nodes), with sparser connections between groups. (For interpretation of the references to color in this figure legend, the reader is referred to the web version of this article.)
Fig. 4
Fig. 4
Connectivity maps for the reward ROI, subgroup A. Results for control children (n = 23) and children with ADHD (n = 10) (A); and direct comparison between groups (B). Results show a specific pattern of atypical connectivity of the reward system in children with ADHD, compared to control children in the same subgroup. Monte Carlo simulation was applied to correct for multiple comparisons (Z > 2.25, p < 0.05).
Fig. 5
Fig. 5
Connectivity maps for the reward ROI, subgroup B. Results for control children (n = 29) and children with ADHD (n = 17) (A); and direct comparison between groups (B). Results show a specific pattern of atypical connectivity of the reward system in children with ADHD, compared to control children in the same subgroup. Monte Carlo simulation was applied to correct for multiple comparisons (Z > 2.25, p < 0.05).
Fig. 6
Fig. 6
Connectivity maps for the reward ROI, subgroup C. Results for control children (n = 11) and children with ADHD (n = 15) (A); and direct comparison between groups (B). Results show a specific pattern of atypical connectivity of the reward system in children with ADHD, compared to control children in the same subgroup. Monte Carlo simulation was applied to correct for multiple comparisons (Z > 2.25, p < 0.05).
Fig. 7
Fig. 7
Brain networks from community detection analysis and color-coded comparison maps. Community detection was applied to the average functional connectivity map of 32 adults; the community assignments were mapped onto ROIs as colors (A). The nine communities found corresponded to known brain networks. Atypical connections of the NAcc in each subgroup were color coded according to which brain network they had the most voxels overlapping with (B). The legend displays colors and names assigned to the nine networks that overlapped with voxels from the comparison maps.
Fig. 8
Fig. 8
Boxplots of ln(k) and activity level scores (from TMCQ) in controls and ADHD children. Boxplots were generated for each subgroup and emphasize that ln(k) and activity level scores were significantly different between controls and ADHD children only within subgroup A. Blue: controls; red: children with ADHD. (For interpretation of the references to color in this figure legend, the reader is referred to the web version of this article.)
Fig. 9
Fig. 9
Connectivity between NAcc and brain networks. The NAcc is functionally connected to several networks. The negative and positive connections have to be balanced in order to provide adapted behavior (i.e. not impulsive). Some connections may be atypical, but still result in adapted behavior, as long as the balance is maintained. Several possible connection combinations may unbalance the system and result in atypical behavior.
Fig. 10
Fig. 10
Color-coded brain networks and schematic representation of the reward system functional connectivity. Atypical connections of the reward ROI in each subgroup were color-coded according to which brain network they had the most voxels overlapping with. The models schematically display the functional connectivity of the reward system in controls and children with ADHD.

References

    1. American Psychiatric Association . 5th ed. American Psychiatric Association; Arlington, VA: 2013. Diagnostic and Statistical Manual of Mental Disorders.
    1. Bitsakou P., Antrop I., Wiersema J.R., Sonuga-Barke E.J. Probing the limits of delay intolerance: preliminary young adult data from the Delay Frustration Task (DeFT) J. Neurosci. Methods. 2006;151(1):38–44. - PubMed
    1. Boccaletti S., Latora V., Moreno Y., Chavez M., Hwang D. Complex networks: structure and dynamics. Phys. Rep. 2006;424(4–5):175–308.
    1. Buckner R.L., Andrews-Hanna J.R., Schacter D.L. The brain's default network: anatomy, function, and relevance to disease. Ann. N.Y. Acad. Sci. 2008;1124:1–38. - PubMed
    1. Bullmore E., Sporns O. Complex brain networks: graph theoretical analysis of structural and functional systems. Nat. Rev. Neurosci. 2009;10(3):186–198. - PubMed

Publication types