. 2015 Mar 1:569:26-31.
doi: 10.1016/j.abb.2015.01.027. Epub 2015 Feb 7.

The effects of sarcolipin over-expression in mouse skeletal muscle on metabolic activity

Affiliations

The effects of sarcolipin over-expression in mouse skeletal muscle on metabolic activity

John Butler et al. Arch Biochem Biophys. .

Abstract

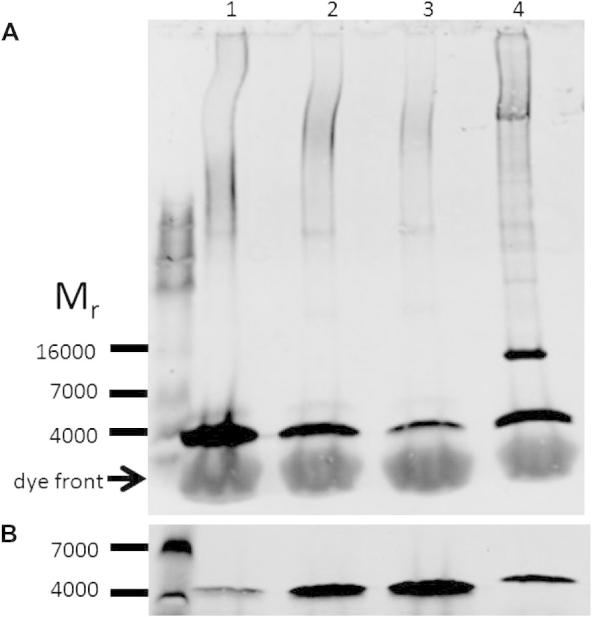
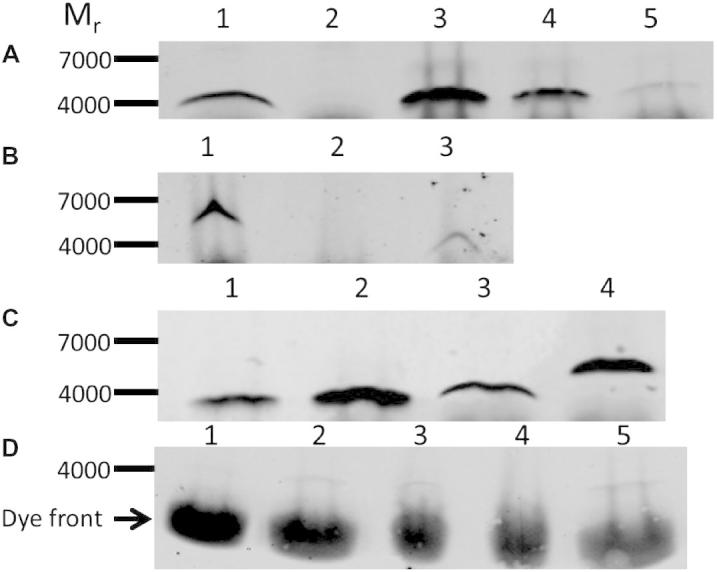
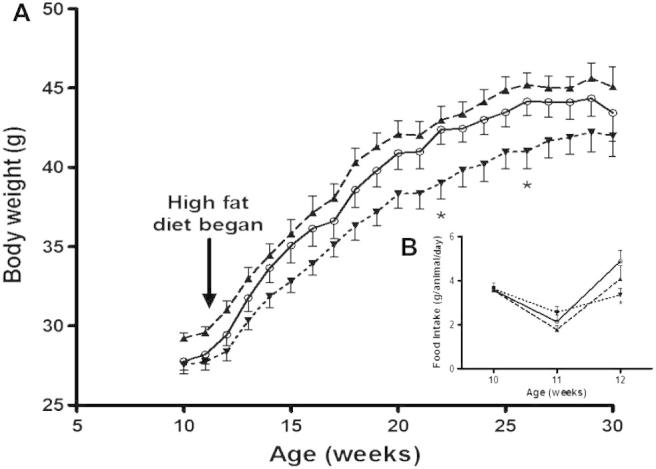
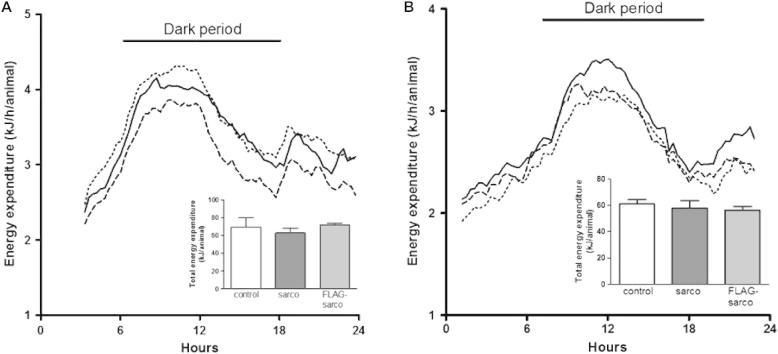
Studies in sarcolipin knockout mice have led to the suggestion that skeletal muscle sarcolipin plays a role in thermogenesis. The mechanism proposed is uncoupling of the sarcoplasmic reticulum calcium pump. However, in other work sarcolipin was not detected in mouse skeletal tissue. We have therefore measured sarcolipin levels in mouse skeletal muscle using semi-quantitative western blotting and synthetic mouse sarcolipin. Sarcolipin levels were so low that it is unlikely that knocking out sarcolipin would have a measurable effect on thermogenesis by SERCA. In addition, overexpression of neither wild type nor FLAG-tagged variants of mouse sarcolipin in transgenic mice had any major significant effects on body mass, energy expenditure, even when mice were fed on a high fat diet.

Keywords: Energy expenditure; High fat diet; Obesity; SERCA; Sarcolipin; Thermogenesis.


Figures

Fig. 1
Fig. 1
(A) Characterisation of sarcolipin levels in mouse atria and rabbit skeletal muscle by semi-quantitative western blotting. 30 μg (protein) of homogenised pooled left and right atrial tissue from 8 to 10 week old FVBN mice was separated by SDS–PAGE (lane 4) and synthetic sarcolipin, 20, 5.0 and 2.5 ng of peptide were included as standards (lanes 1, 2 and 3 respectively). Following the transfer of the proteins from the gel to PVDF membranes the blots were probed with anti-sarcolipin antibody, followed by a goat anti-rabbit fluorophore conjugated antibody. (B) SR, 1 μg, from a 3 kg New Zealand white rabbit was separated by SDS–PAGE (lane 4) and synthetic sarcolipin, 20, 40 and 60 ng (lanes 1–3). The blots were visualised and analysed using the LI-COR ODYSSEY detection system. Blots shown are typical of at least two determinations.
Fig. 2
Fig. 2
Expression of sarcolipin and FLAG-tagged sarcolipin in the skeletal muscle of transgenic and control mice detected by western blotting. (A) 40 μg (protein) of sarcoplasmic reticulum from sarcolipin+/+ transgenic mice and FVBN control mice (from total limb skeletal muscle) were separated by SDS–PAGE (lanes 1 and 2, respectively). Synthetic sarcolipin, 10, 5 and 1 ng of peptide were included as standards (lanes 3, 4 and 5, respectively). (B) 100 μg of homogenised total limb skeletal muscle from FLAG-tagged sarcolipin+/+, C57BL/6 and sarcolipin+/+ mice were separated by SDS–PAGE (lanes 1, 2 and 3, respectively). (C) 40 μg (protein) of sarcoplasmic reticulum from sarcolipin+/+ and FLAG-tagged sarcolipin+/+ transgenic mice (from total limb skeletal muscle) were separated by SDS–PAGE (lanes 3 and 4, respectively). Synthetic sarcolipin, 20 and 40 ng of peptide were included as standards (lanes 1 and 2). All mice used for the analyses above were aged 8–10 weeks (D) 120 μg (protein) of homogenised soleus muscle from 30 week old FVBN mice was separated by SDS–PAGE; mice were fed on the high fat diet from week 11–30 weeks (lane 3) or a standard chow diet throughout (lane 4). Synthetic sarcolipin, 1.0, 2.0 and 3 ng of peptide were included as standards (lanes 1, 2 and 5, respectively). In all cases, following the transfer of the proteins from the gel to PVDF membranes the blots were probed with anti-sarcolipin antibody, followed by a goat anti-rabbit fluorophore conjugated antibody. The blots were visualised and analysed using the LI-COR ODYSSEY detection system. Blots shown are typical of at least two determinations.
Fig. 3
Fig. 3
Immunolocalisation of SERCA and FLAG-tagged sarcolipin in mouse skeletal muscle. Frozen sections of skeletal muscle from transgenic mice expressing FLAG-tagged sarcolipin were acetone fixed, blocked for 1 h in PBST containing 10% BSA. The sections were then incubated with Anti-FLAG-FITC conjugate antibody (1:100) rabbit polyclonal anti-SERCA1/2/3 (1:100) (Santa Cruz). The primary antibodies were detected using donkey anti-rabbit Texas red conjugate (1:100). Following washing the section was incubated with DAPI stain 1 μg/ml and mounted in Mowiol containing 0.1% citifluor. FITC fluorescence is shown in panel A; Texas red fluorescence in panel B; DAPI fluorescence in panel C and FITC, DAPI and Texas red merged in panel D.
Fig. 4
Fig. 4
Effect of high fat diet on the body weight of sarcolipin over-expressing and FLAG-tagged sarcolipin expressing mice. (A) Male wild type (, solid line), sarcolipin over-expressing (, dashed line) and FLAG-tagged sarcolipin expressing (, dotted line) mice were fed on a standard chow diet until 11 weeks of age after which they were transferred onto a high fat (60%) diet. Body weight was measured on a weekly basis. The bars indicate standard error of the mean, n = 14. P < 0.05 for FLAG-sarcolipin overexpressing mice compared to control mice by one-way ANOVA followed by Dunnett’s test at 22 and 26 weeks of age. (B, inset) Food intake was measured during the transition from standard chow to high fat diet. The bars indicate standard error of the mean, n = 14. P < 0.05 for FLAG-sarcolipin overexpressing mice compared to control mice by two-way ANOVA followed by Bonferroni multiple comparisons test.
Fig. 5
Fig. 5
Effect of sarcolipin over-expression and FLAG-sarcolipin expression by skeletal muscle on metabolic rate. Hourly energy expenditure 1 week before (A) and 15 weeks after (B) the introduction of the high fat diet in male wild type (solid line), sarcolipin over-expressing (dashed line) and FLAG-tagged sarcolipin expressing (dotted line). Error bars have been omitted for clarity since the objective is to show that the diurnal rhythm of energy expenditure was similar in all genotypes Total energy expenditure over 24 h at 10 weeks of age and over 22 h at 26 weeks of age is shown in (A inset) and (B inset) respectively; n = 7 cages. There were no significant differences in energy expenditure at any hourly time point or in total.

References

    1. Asahi M., Sugita Y., Kurzydlowski K., de Leon S., Tada M., Toyoshima C., MacLennan D.H. Proc. Natl. Acad. Sci. (USA) 2003;100:5040–5045. - PMC - PubMed
    1. Odermatt A., Becker S., Khanna V.K., Kurzydlowski K., Leisner E., Pette D. J. Biol. Chem. 1998;273:12360–12369. - PubMed
    1. Smith W.S., Broadbridge R., East J.M., Lee A.G. Biochem. J. 2002;361:277–286. - PMC - PubMed
    1. Mall S., Broadbridge R., Harrison S.L., Gore M.G., Lee A.G., East J.M. J. Biol. Chem. 2006;281:36597–36602. - PubMed
    1. Bal N.C., Maurya S.K., Sopariwala D.H., Sahoo S.K., Gupta S.C., Shaikh S.A., Pant M., Rowland L.A., Bombardier E., Goonasekera S.A., Tupling A.R., Molkentin J.D., Periasamy M. Nat. Med. 2012;18:1575–1579. - PMC - PubMed

Publication types

MeSH terms

LinkOut - more resources