

How to stop or change a motor response: Laplacian and independent component analysis approach
- PMID: 25660306
- PMCID: PMC4529397
- DOI: 10.1016/j.ijpsycho.2015.01.012
How to stop or change a motor response: Laplacian and independent component analysis approach
Abstract
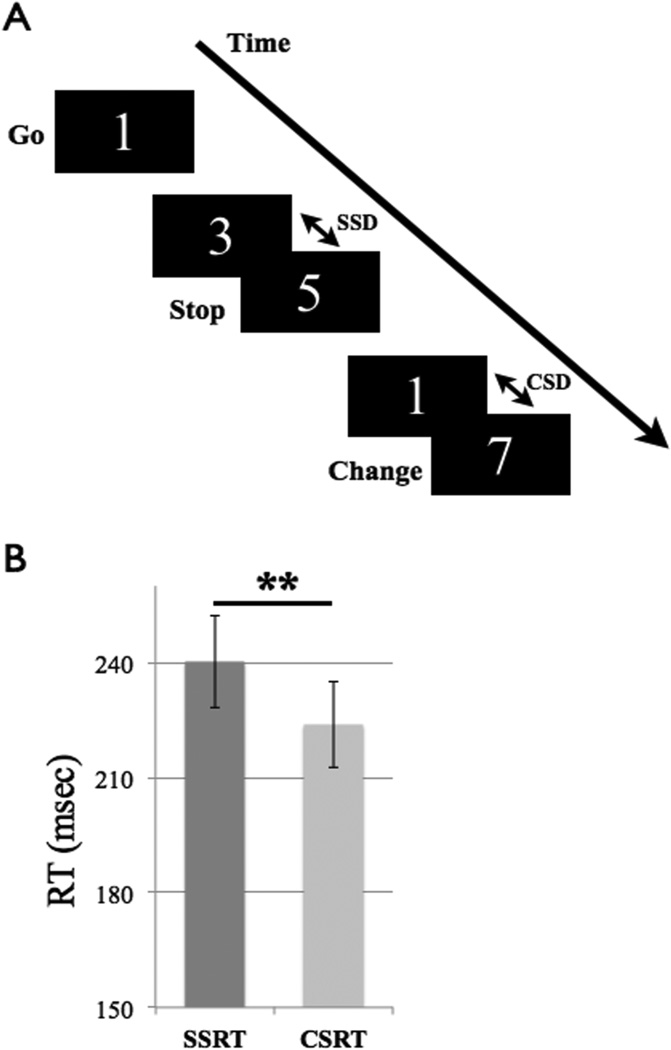
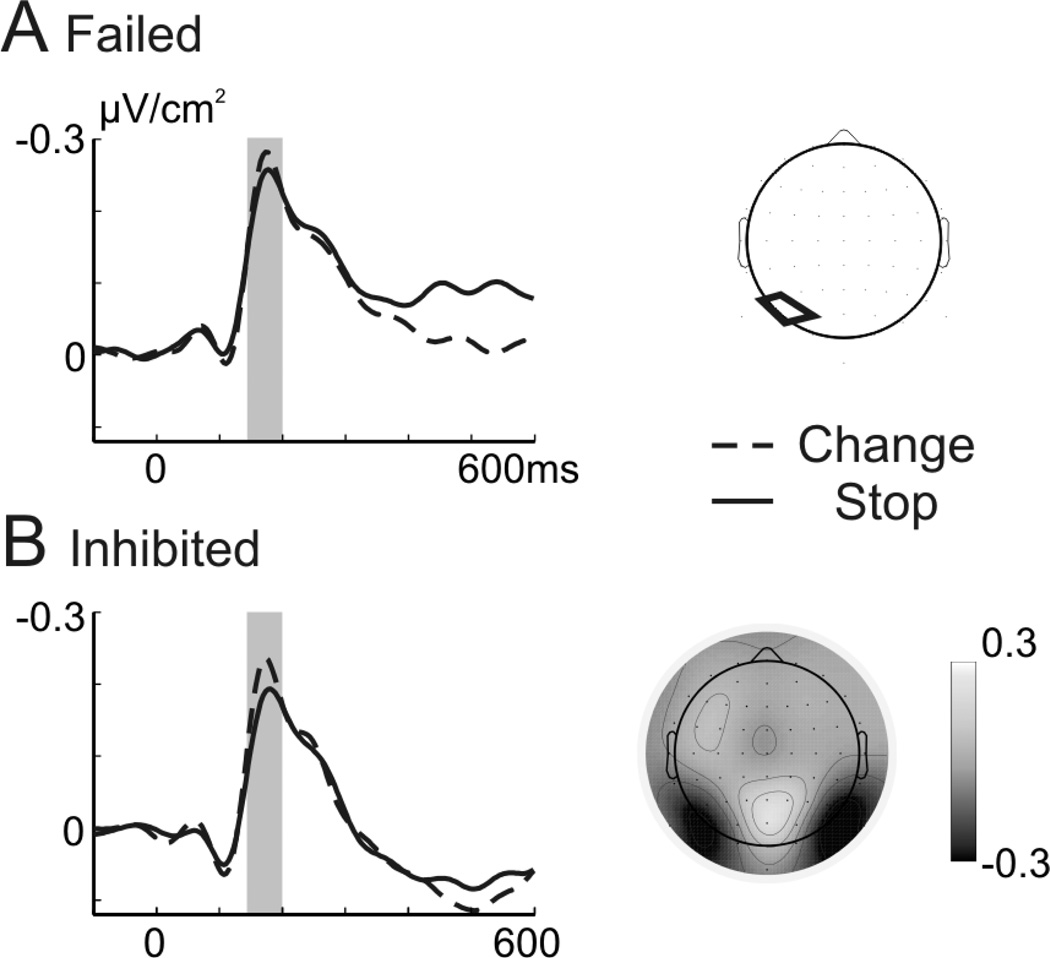
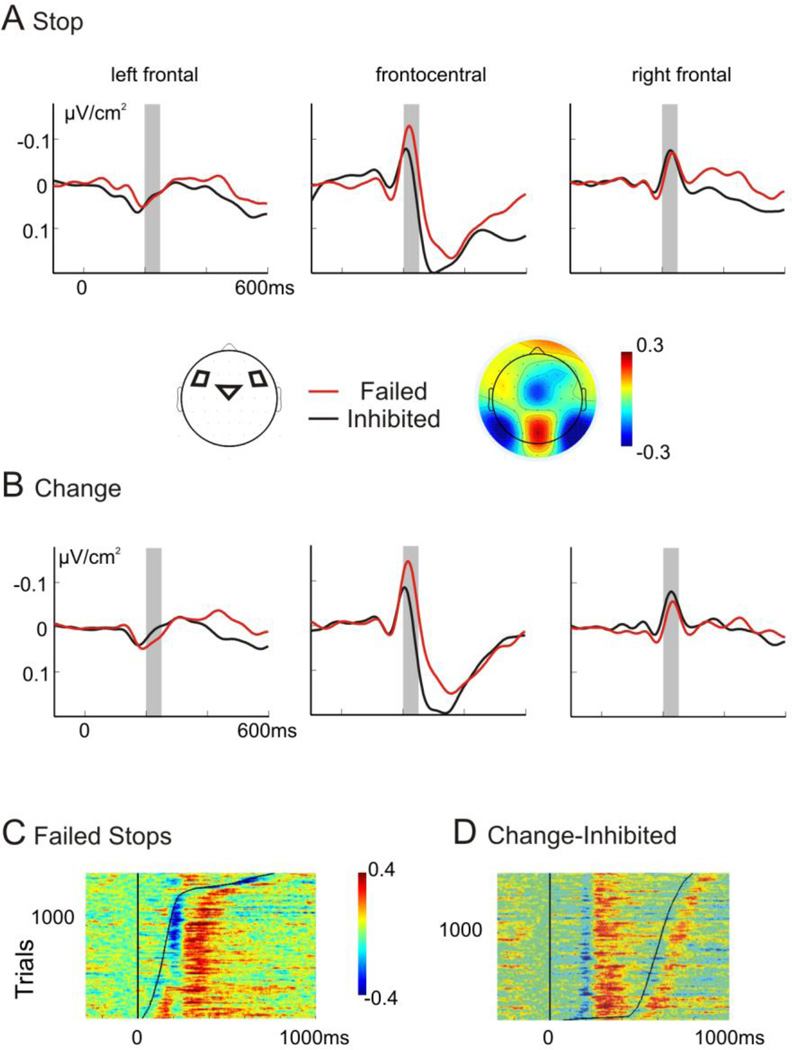
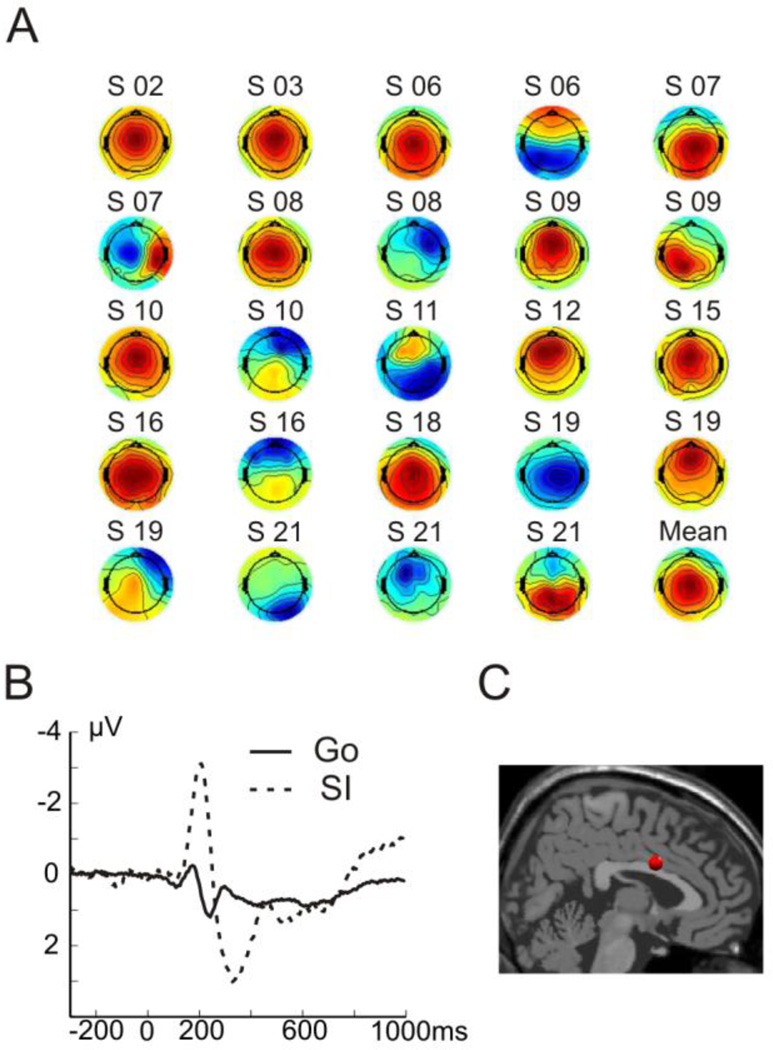
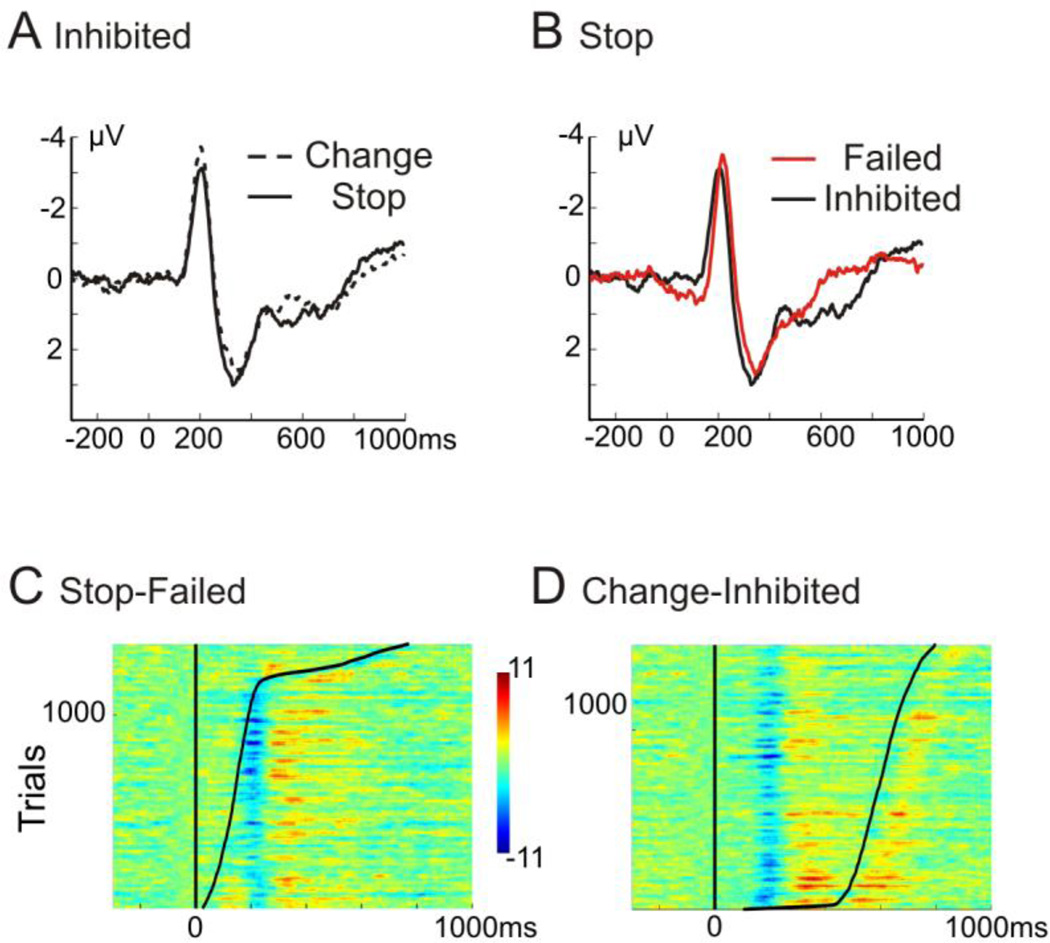
Response inhibition is an essential control function necessary to adapt one's behavior. This key cognitive capacity is assumed to be dependent on the prefrontal cortex and basal ganglia. It is unresolved whether varying inhibitory demands engage different control mechanisms or whether a single motor inhibitory mechanism is involved in any situation. We addressed this question by comparing electrophysiological activity in conditions that require stopping a response to conditions that require switching to an alternate response. Analyses of electrophysiological data obtained from stop-signal tasks are complicated by overlapping stimulus-related activity that is distributed over frontal and parietal cortical recording sites. Here, we applied Laplacian transformation and independent component analysis (ICA) to overcome these difficulties. Participants were faster in switching compared to stopping a response, but we did not observe differences in neural activity between these conditions. Both stop- and change-trials Laplacian transformed ERPs revealed a comparable bilateral parieto-occipital negativity around 180 ms and a frontocentral negativity around 220 ms. ICA results suggested an inhibition-related frontocentral component which was characterized by a negativity around 200 ms with a likely source in anterior cingulate cortex. The data provide support for the importance of posterior mediofrontal areas in inhibitory response control and are consistent with a common neural pathway underlying stopping and changing of a motor response. The methodological approach proved useful to distinguish frontal and parietal sources despite similar timing and the ICA approach allowed assessment of single-trial data with respect to behavioral data.
Keywords: Cognitive control; Independent component analysis; Laplacian; Stop-signal task.
Copyright © 2015 Elsevier B.V. All rights reserved.
Figures

Similar articles
-
Neural Architecture of Selective Stopping Strategies: Distinct Brain Activity Patterns Are Associated with Attentional Capture But Not with Outright Stopping.J Neurosci. 2017 Oct 4;37(40):9785-9794. doi: 10.1523/JNEUROSCI.1476-17.2017. Epub 2017 Sep 8. J Neurosci. 2017. PMID: 28887387 Free PMC article.
-
Electrophysiological activity underlying inhibitory control processes in normal adults.Neuropsychologia. 2006;44(3):384-95. doi: 10.1016/j.neuropsychologia.2005.06.005. Epub 2005 Aug 10. Neuropsychologia. 2006. PMID: 16095637
-
Neural and behavioral correlates of selective stopping: Evidence for a different strategy adoption.Neuroimage. 2016 Oct 1;139:279-293. doi: 10.1016/j.neuroimage.2016.06.043. Epub 2016 Jun 26. Neuroimage. 2016. PMID: 27355436
-
Electroencephalography of response inhibition tasks: functional networks and cognitive contributions.Int J Psychophysiol. 2013 Mar;87(3):217-33. doi: 10.1016/j.ijpsycho.2012.08.001. Epub 2012 Aug 17. Int J Psychophysiol. 2013. PMID: 22906815 Review.
-
Partial response electromyography as a marker of action stopping.Elife. 2022 May 26;11:e70332. doi: 10.7554/eLife.70332. Elife. 2022. PMID: 35617120 Free PMC article. Review.
Cited by
-
Error monitoring when no errors are possible: Arbitrary free-choice decisions invoke error monitoring processes.iScience. 2023 Mar 10;26(4):106373. doi: 10.1016/j.isci.2023.106373. eCollection 2023 Apr 21. iScience. 2023. PMID: 37009217 Free PMC article.
-
The Reaction Switching Produces A Greater Bias to Prepotent Response than Reaction Inhibition.Brain Sci. 2020 Mar 24;10(3):188. doi: 10.3390/brainsci10030188. Brain Sci. 2020. PMID: 32213960 Free PMC article.
-
Common and unique neurophysiological signatures for the stopping and revising of actions reveal the temporal dynamics of inhibitory control.bioRxiv [Preprint]. 2024 Jun 22:2024.06.18.597172. doi: 10.1101/2024.06.18.597172. bioRxiv. 2024. Update in: J Neurosci. 2025 Mar 26;45(13):e1537242025. doi: 10.1523/JNEUROSCI.1537-24.2025. PMID: 38948849 Free PMC article. Updated. Preprint.
-
On the benefits of using surface Laplacian (current source density) methodology in electrophysiology.Int J Psychophysiol. 2015 Sep;97(3):171-3. doi: 10.1016/j.ijpsycho.2015.06.001. Epub 2015 Jun 10. Int J Psychophysiol. 2015. PMID: 26071227 Free PMC article. No abstract available.
-
Abnormal gait and motor cortical processing in drug-resistant juvenile myoclonic epilepsy.Brain Behav. 2023 Feb;13(2):e2872. doi: 10.1002/brb3.2872. Epub 2023 Jan 5. Brain Behav. 2023. PMID: 36602919 Free PMC article.
References
-
- Aron AR, Robbins TW, Poldrack RA. Inhibition and the right inferior frontal cortex. Trends in cognitive sciences. 2004;8:170–177. - PubMed
-
- Aron AR, Robbins TW, Poldrack RA. Inhibition and the right inferior frontal cortex: one decade on. Trends Cogn Sci. 2014 - PubMed
-
- Azizian A, Freitas AL, Parvaz MA, Squires NK. Beware misleading cues: perceptual similarity modulates the N2/P3 complex. Psychophysiology. 2006;43:253–260. - PubMed
Publication types
MeSH terms
Grants and funding
LinkOut - more resources
Full Text Sources
Other Literature Sources
Miscellaneous
