. 2015 Mar 10;4(3):332-9.
doi: 10.1016/j.stemcr.2015.01.001. Epub 2015 Feb 5.

In vivo therapeutic potential of mesenchymal stromal cells depends on the source and the isolation procedure

Affiliations

In vivo therapeutic potential of mesenchymal stromal cells depends on the source and the isolation procedure

Francesca Bortolotti et al. Stem Cell Reports. .

Abstract

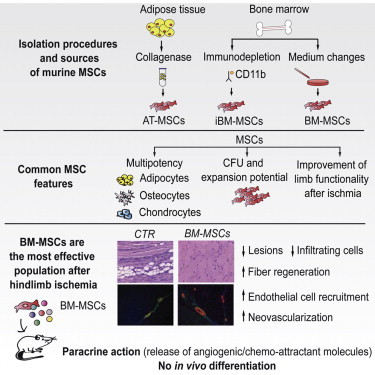
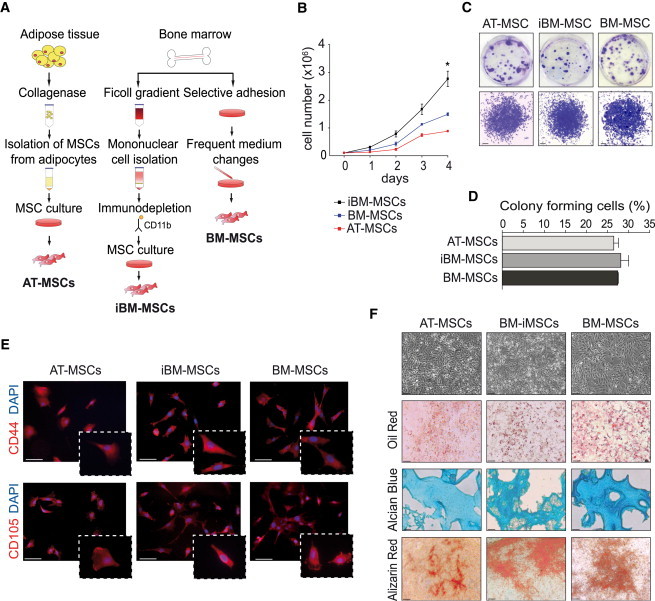
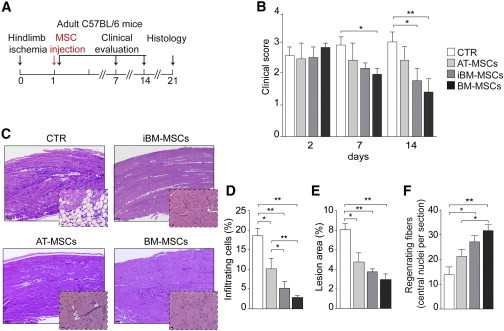
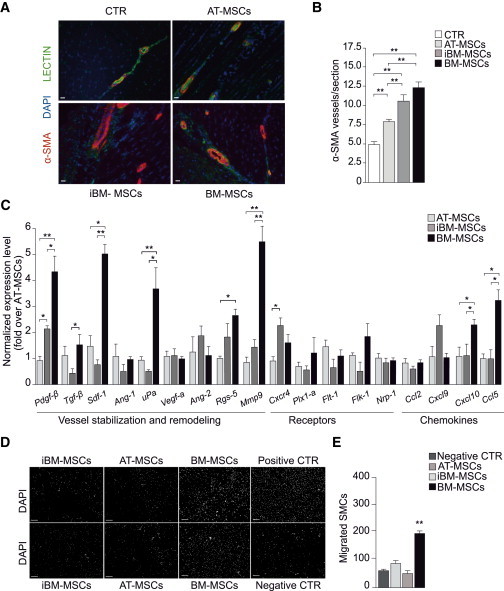
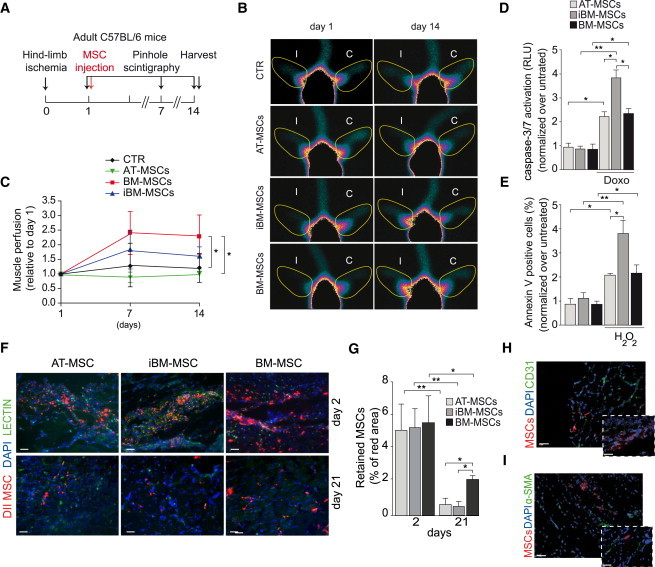
Over the last several years, mesenchymal stromal cells (MSCs) have been isolated from different tissues following a variety of different procedures. Here, we comparatively assess the ex vivo and in vivo properties of MSCs isolated from either adipose tissue or bone marrow by different purification protocols. After MSC transplantation into a mouse model of hindlimb ischemia, clinical and histological analysis revealed that bone marrow MSCs purified on adhesive substrates exerted the best therapeutic activity, preserving tissue viability and promoting formation of new arterioles without directly transdifferentiating into vascular cells. In keeping with these observations, these cells abundantly expressed cytokines involved in vessel maturation and cell retention. These findings indicate that the choice of MSC source and purification protocol is critical in determining the therapeutic potential of these cells and warrant the standardization of an optimal MSC isolation procedure in order to select the best conditions to move forward to more effective clinical experimentation.


Figures

None
Graphical abstract
Figure 1
Figure 1
Characterization of MSCs Isolated according to Three Different Procedures (A) Schematic overview of MSCs isolation procedures. (B) Counting of AT-MSCs, BM-MSCs, and iBM-MSCs for 4 consecutive days. Data (n = 3 biological replicates) are presented as mean ± SEM (p < 0.05). (C) Crystal violet staining of MSCs showing colonies after 10 days of culture (upper panels) and a representative colony (lower panels). Scale bar, 100 μm. (D) Quantification of colonies formed after 10 days of cell culture. Data (n = 3 biological replicates) are presented as mean ± SEM. (E) MSC immunophenotyping at passage 3. CD44 or CD105, red; DAPI, blue; scale bar, 50 μm. (F) All MSCs exhibited a similar morphology and became positive for oil red (adipocytic differentiation; scale bar, 50 μm), alcian blue (chondrocytic differentiation; scale bar 50 μm), and alizarin red (osteocytic differentiation; scale bar, 80 μm).
Figure 2
Figure 2
Morphological and Functional Evaluation of the Therapeutic Effect of MSCs (A) CLI experimental flow chart. Mice were injected with AT-MSCs, BM-MSCs, or iBM-MSCs at passage 3–5 or medium (n = 10 animals per group). (B) Limb function evaluation at days 2, 7, and 21 after CLI according to the criteria described in Table S2. (C) Representative hematoxylin-eosin staining of ischemic muscle from untreated and treated animals at day 21. Scale bar represents 100 μm for lower magnification and 10 μm for higher magnification. (D) Percentage of infiltrating cells at the site of ischemia. (E) Percentage of muscle affected by ischemic damage. (F) Quantification of central nuclei as a hallmark of muscle regeneration. Data in (B) and (D)–(F) are expressed as mean ± SEM (n = 10 animals per group; p < 0.05, ∗∗p < 0.01).
Figure 3
Figure 3
MSC Treatment Effectively Induces Neovascularization in Ischemic Muscles (A) Representative immunostaining for vascular structures at day 21. α-SMA, red; lectin, green; DAPI, blue; scale bar, 50 μm. (B) Number of α-SMA positive vessels. Data (n = 10 animals per group) are expressed as mean ± SEM (p < 0.05, ∗∗p < 0.01). (C) Quantification of mRNA levels of factors involved in angiogenesis, vessel stabilization, and remodeling (n = 3 biological replicates). Expression of each gene was first normalized over Gapdh and then over AT-MSCs. (D) Representative images of murine SMCs migrated in response to the various MSCs. SMCs were seeded on the upper chamber and stained with DAPI after migration to the bottom side of the filter. MSCs were seeded in the lower chamber (n = 3 biological replicates). Serum-free medium and serum-rich medium were used as negative and positive controls; scale bar, 100 μm. (E) Quantification of SMCs migrated in response to the various MSCs, expressed as number of migrated cells per 100× field. Data in (B), (C), and (E) are expressed as mean ± SEM (p < 0.05, ∗∗p < 0.01).
Figure 4
Figure 4
MSCs Induce Functional Vascularization but Do Not Differentiate into Vascular Structures In Vivo (A) Planar scintigraphy experimental flow chart (n = 8 animals per group). (B) Representative images showing the regions of interest (yellow line) used to quantify muscle perfusion on the ischemic (I) and control (C) limb at the indicated time points. (C) Quantification of muscle perfusion, normalized over the perfusion measured at day 1. (D) Level of caspase activation in MSCs exposed to doxorubicin, normalized over untreated cells (n = 9, 3 biological and 3 technical replicates). (E) Percentage of Annexin V+ cells after exposure to H2O2, normalized over untreated cells (n = 9, 3 biological and 3 technical replicates). (F) Representative images of MSC engraftment at days 2 and 21. DiI-labeled MSCs, red; lectin, green; DAPI, blue; scale bar, 50 μm. (G) Quantification of cell engraftment at the indicated time points (n = 6 animals per group). (H) Representative images of DiI-labeled BM-MSCs (red) stained for CD31 (green). Nuclei are counterstained with DAPI (blue). Scale bar represents 25 μm for lower magnification and 40 μm for higher magnification. (I) Representative images of DiI-labeled BM-MSCs (red) stained for α-SMA (green). Nuclei are counterstained with DAPI (blue). Scale bars as in (H). Data in (C)–(E) and (G) are expressed as mean ± SEM (p < 0.05, ∗∗p < 0.01).

References

    1. Abbott J.D., Huang Y., Liu D., Hickey R., Krause D.S., Giordano F.J. Stromal cell-derived factor-1alpha plays a critical role in stem cell recruitment to the heart after myocardial infarction but is not sufficient to induce homing in the absence of injury. Circulation. 2004;110:3300–3305. - PubMed
    1. Boxall S.A., Jones E. Markers for characterization of bone marrow multipotential stromal cells. Stem Cells Int. 2012;2012:975871. - PMC - PubMed
    1. Chen L., Tredget E.E., Wu P.Y., Wu Y. Paracrine factors of mesenchymal stem cells recruit macrophages and endothelial lineage cells and enhance wound healing. PLoS One. 2008;3:e1886. - PMC - PubMed
    1. Cho H.H., Kim Y.J., Kim J.T., Song J.S., Shin K.K., Bae Y.C., Jung J.S. The role of chemokines in proangiogenic action induced by human adipose tissue-derived mesenchymal stem cells in the murine model of hindlimb ischemia. Cell. Physiol. Biochem. 2009;24:511–518. - PubMed
    1. Gerthoffer W.T. Mechanisms of vascular smooth muscle cell migration. Circ. Res. 2007;100:607–621. - PubMed

Publication types