. 2015 Mar 2;25(5):546-55.
doi: 10.1016/j.cub.2014.12.049. Epub 2015 Feb 5.

Rph1/KDM4 mediates nutrient-limitation signaling that leads to the transcriptional induction of autophagy

Affiliations

Rph1/KDM4 mediates nutrient-limitation signaling that leads to the transcriptional induction of autophagy

Amélie Bernard et al. Curr Biol. .

Abstract

Background: Autophagy is a conserved process mediating vacuolar degradation and recycling. Autophagy is highly upregulated upon various stresses and is essential for cell survival in deleterious conditions. Autophagy defects are associated with severe pathologies, whereas unchecked autophagy activity causes cell death. Therefore, to support proper cellular homeostasis, the induction and amplitude of autophagy activity have to be finely regulated. Transcriptional control is a critical, yet largely unexplored, aspect of autophagy regulation. In particular, little is known about the signaling pathways modulating the expression of autophagy-related genes, and only a few transcriptional regulators have been identified as contributing in the control of this process.

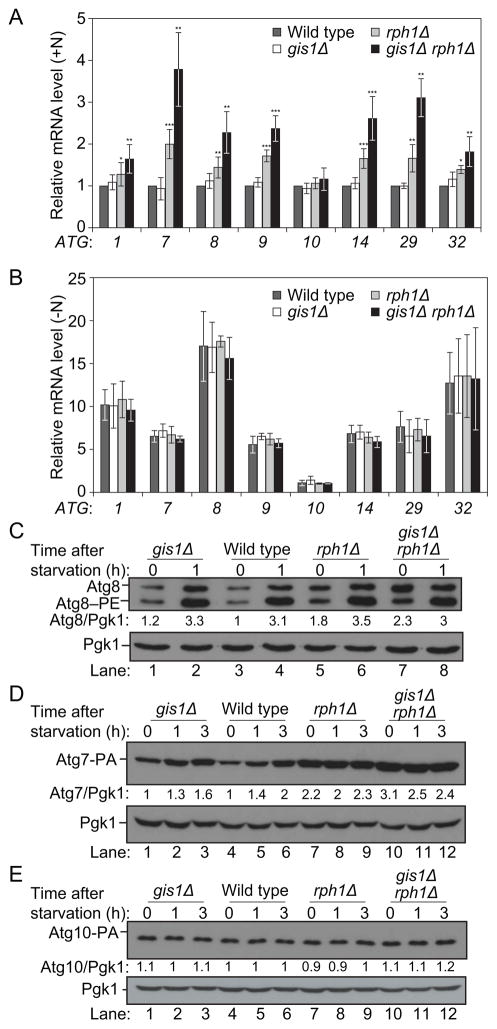
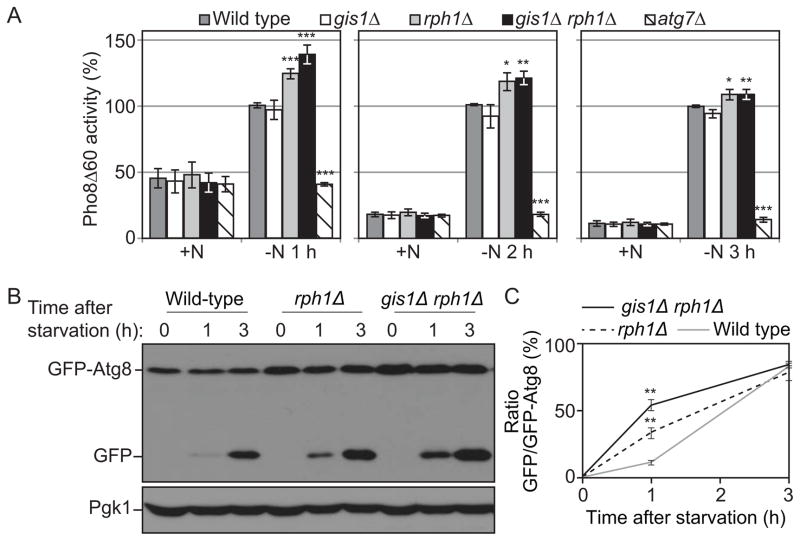
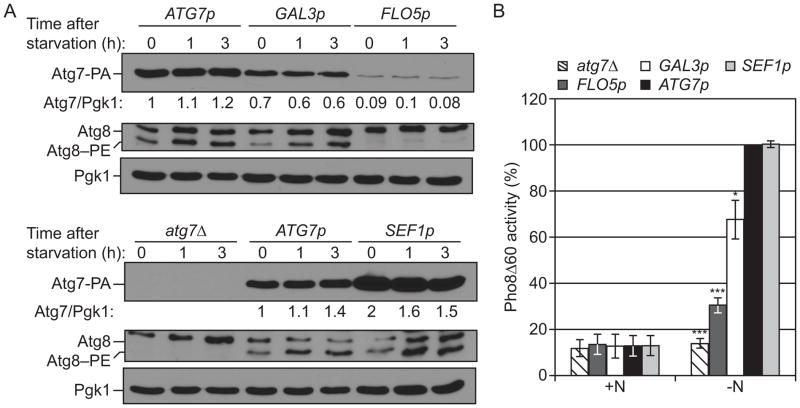
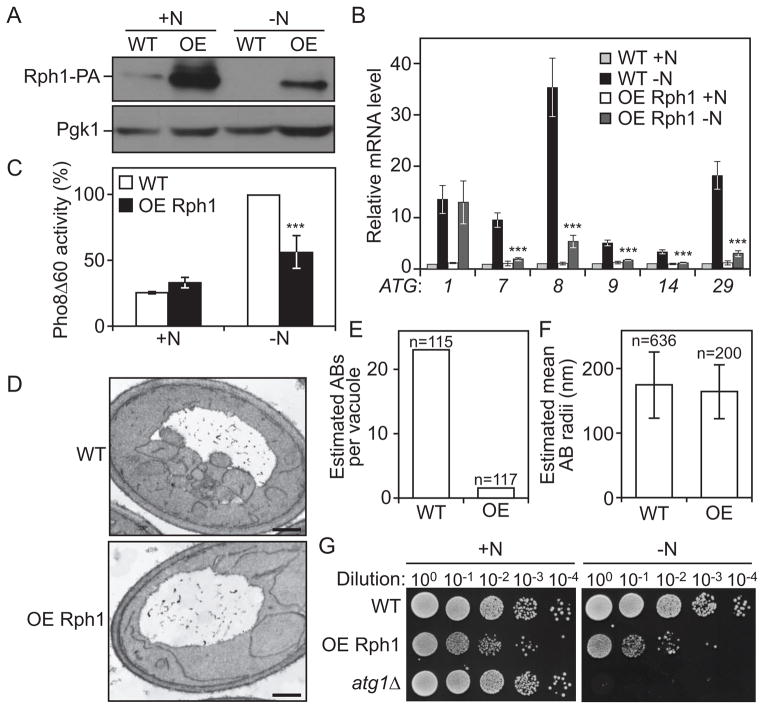
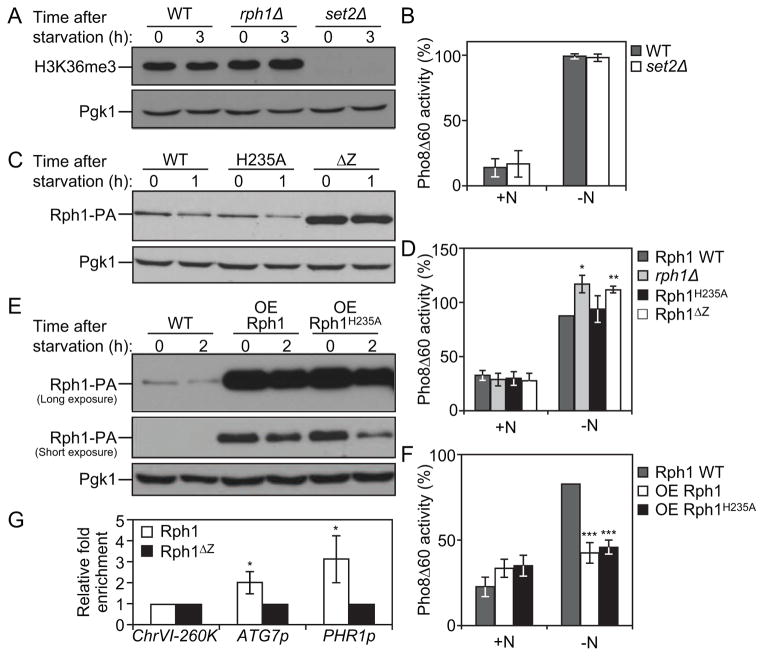
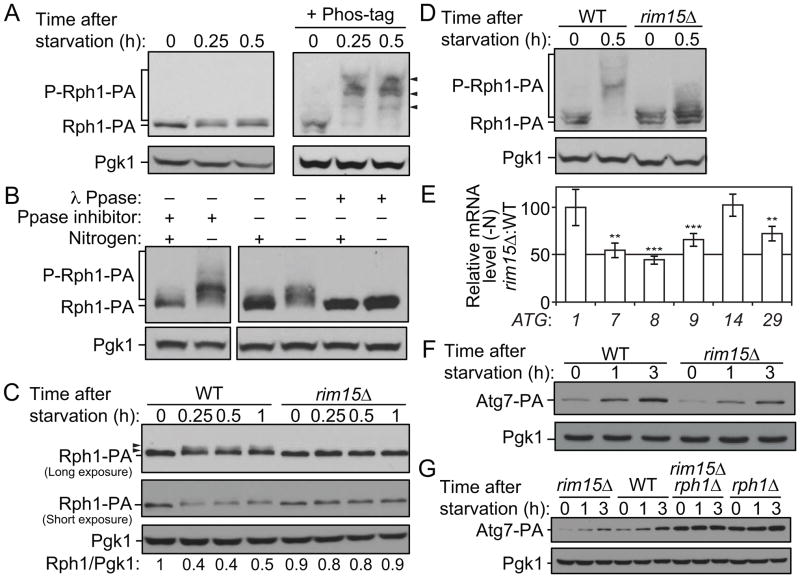
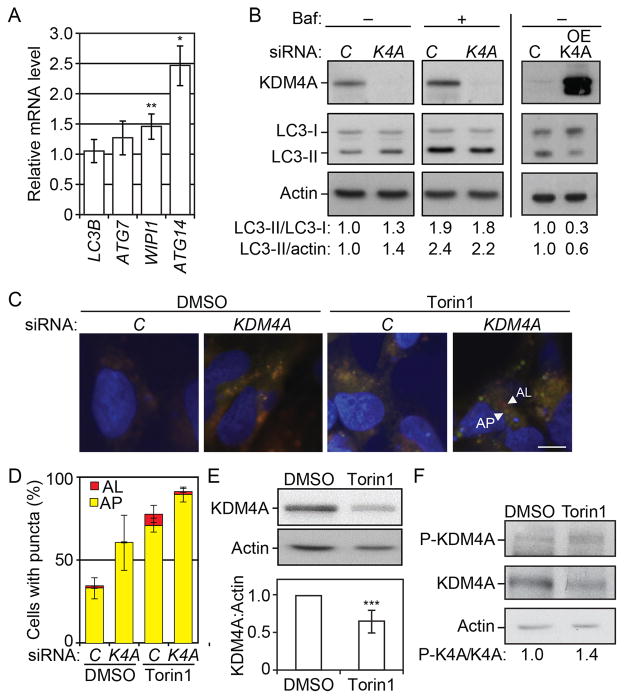
Results: We identified Rph1 as a negative regulator of the transcription of several ATG genes and a repressor of autophagy induction. Rph1 is a histone demethylase protein, but it regulates autophagy independently of its demethylase activity. Rim15 mediates the phosphorylation of Rph1 upon nitrogen starvation, which causes an inhibition of its function. Preventing Rph1 phosphorylation or overexpressing the protein causes a severe block in autophagy induction. A similar function of Rph1/KDM4 is seen in mammalian cells, indicating that this process is highly conserved.

Conclusion: Rph1 maintains autophagy at a low level in nutrient-rich conditions; upon nutrient limitation, the inhibition of its activity is a prerequisite to the induction of ATG gene transcription and autophagy.


Figures

Figure 1
Figure 1. Rph1 represses the expression of nitrogen-sensitive ATG genes in nutrient-replete conditions
(A–B) Rph1 represses the expression of ATG1, ATG7, ATG8, ATG9, ATG14 and ATG29 in nutrient-replete conditions. Wild-type (YTS158), rph1Δ (YAB300), gis1Δ (YAB301) and gis1Δ rph1Δ (YAB302) cells were grown in YPD (+N) until mid-log phase (A) and then starved for nitrogen (−N) for 1 h (B). mRNA levels were quantified by RT-qPCR. Error bars indicate the standard deviation of the average of at least 3 independent experiments. (C–E) Rph1 represses the expression of the Atg7 and Atg8 proteins. (C) For the analysis of Atg8, wild-type (YTS158, BY4742), rph1Δ (YAB300), gis1Δ (YAB301) and gis1Δ rph1Δ (YAB302) cells were grown in YPD until mid-log phase and then starved for nitrogen for the indicated times. Protein extracts were analyzed by western blot with anti-Atg8 and anti-Pgk1 (loading control) antisera. (D) To analyze Atg7 abundance, a protein A tag was integrated at the chromosomal locus. Wild-type (YAB312, BY4742), rph1Δ (YAB313), gis1Δ (YAB314) and gis1Δ rph1Δ (YAB315) cells were grown in the same conditions as in (C). Protein extracts were analyzed as in (C) with an antibody that detects PA or anti-Pgk1 antiserum. (E) To analyze Atg10 abundance, a protein A tag was integrated at the chromosomal locus. Wild-type (YAB350, BY4742), rph1Δ (YAB351), gis1Δ (YAB352) and gis1Δ rph1Δ (YAB353) cells were grown in the same conditions as in (C). Protein extracts were analyzed as in (D). (See also Figure S1, Table S1 and Table S2.)
Figure 2
Figure 2. Rph1 negatively regulates autophagy
(A) Autophagy as measured by the Pho8Δ60 assay is increased in rph1Δ and gis1Δ rph1Δ cells. Wild-type (YTS158, BY4742), rph1Δ (YAB300), gis1Δ (YAB301), gis1Δ rph1Δ (YAB302) and atg7Δ (YAB292) cells were grown in YPD (+N) and then starved for nitrogen (−N) for the indicated times. The Pho8Δ60 activity was measured and normalized to the activity of wild-type cells after starvation, which was set to 100% at each time point. The data represent the average of 3 independent experiments; error bars indicate standard deviation. (B) Autophagy as measured by the GFP-Atg8 processing is increased in rph1Δ and gis1Δ rph1Δ cells. Wild-type (YTS158, BY4742), rph1Δ (YAB300) and gis1Δ rph1Δ (YAB302) cells transformed with a CEN plasmid carrying a GFP-Atg8 construct were grown in rich selective medium and then starved for 1 and 3 h. Cells were collected and protein extracts were analyzed by western blot with anti-YFP antibody and anti-Pgk1 (loading control) antiserum. (C) Quantification of (B). The ratio free GFP:GFP-Atg8 was measured and normalized to that of wild-type cells after 3 h starvation, which was set to 100%. Average values ± standard deviations of 2 independent experiments are indicated.
Figure 3
Figure 3. The level of Atg7 regulates autophagy
(A) Lowering the level of Atg7 results in a decrease in Atg8–PE conjugation and (B) a decrease in autophagy activity. atg7Δ cells (YAB292) were transformed with the ATG7p-ATG7-PA, GAL3p-ATG7-PA, FLO5p-ATG7-PA, or SEF1p-ATG7-PA plasmid or the corresponding empty plasmid (pRS416-PA). Cells were grown in rich selective medium (SMD-Ura) until mid log phase and then starved for nitrogen for the indicated times. (A) Cells were collected and protein extracts were analyzed by western blot with either an antibody that recognizes PA, or anti-Atg8 and anti-Pgk1 (loading control) antisera. (B) Cells were starved for 3 h. The Pho8Δ60 activity was measured and normalized to the activity of ATG7p-ATG7-PA cells, which was set to 100%. Data represent the average of 3 independent experiments.
Figure 4
Figure 4. The overexpression of Rph1 inhibits autophagy and decreases cell survival in nitrogen starvation conditions
(A–C) Overexpressed Rph1 (ZEO1p-RPH1-PA) results in a block in ATG genes expression and autophagy flux. Rph1-PA cells (WT, YAB323, SEY6210) and cells overexpressing Rph1-PA (OE Rph1, YAB329) were grown in YPD (+N) until mid-log phase and then starved for nitrogen (−N). (A) Cells were starved for 2 h, and protein extracts were analyzed by western blot with either an antibody that recognizes PA or anti-Pgk1 (loading control) antiserum. (B) Total RNA of cells in mid-log phase (+N) as well as after 1 h of nitrogen starvation (−N) was extracted and the mRNA levels were quantified by RT-qPCR. The mRNA level of individual ATG genes was normalized to the mRNA level of the corresponding gene in Rph1-PA cells (WT), which was set to 1. Data represent the average of 3 independent experiments ± standard deviation. (C) The Pho8Δ60 activity was measured and normalized to the activity of Rph1-PA cells (WT) after 2 h of nitrogen starvation (−N), which was set to 100%. Error bars indicate standard deviation of 3 independent experiments. (D–E) Rph1 overexpression blocks the biogenesis of autophagic bodies. Wild-type cells (WT, FRY143) and cells overexpressing Rph1 (OE Rph1, YAB346) were imaged using transmission electron microscopy after 2 h of nitrogen starvation. (D) Representative TEM images showing a reduced accumulation of autophagic bodies in the vacuole of cells overexpressing Rph1 compared to wild type. Scale bar, 500 nm. (E) Estimated average number of autophagic bodies (AB) per vacuole. Estimation was based on the number of autophagic body cross-sections observed by TEM [50]. Over 100 unique cells per strain were captured and analyzed. (F) The estimated mean radii (in nm) of the original autophagic bodies (AB) observed by TEM in wild-type and OE Rph1 cells was analyzed as in (E). (G) Rph1 overexpression reduces cell survival after prolonged nitrogen starvation. Rph1-PA cells (WT, YAB323, SEY6210), cells overexpressing Rph1-PA (OE-Rph1, YAB329) and atg1Δ cells (WLY192) were grown in YPD (+N) until mid-log phase and then starved for nitrogen for 15 days (−N). Dilutions as indicated were grown on YPD plates for 2 days, then imaged. (See also Figure S2 and Table S3.)
Figure 5
Figure 5. Rph1 DNA binding ability but not histone demethylase activity is required for its function in autophagy
(A) Wild-type (YTS158), rph1Δ (YAB300) and set2Δ (YAB318) cells were grown in YPD (+N) and then starved for nitrogen (−N) for 3 h. Protein extracts were analyzed by western blot with anti-H3K36me3 antibody and anti-Pgk1 (loading control) antiserum. (B) Wild-type (YTS158, BY4742) and set2Δ (YAB318) cells were grown in YPD (+N) and then starved for nitrogen (−N) for 3 h. The Pho8Δ60 activity was measured and normalized to the activity of wild-type cells, which was set to 100%. For panels B, D, F and G, the data represent the average of 3 independent experiments ± standard deviation. (C–D) rph1Δ cells were transformed with the RPH1p-RPH1-PA (Rph1, Wild-type), RPH1p-RPH1H235A-PA (H235A), or RPH1p-RPH1ΔZ-PA (ΔZ) plasmids or the corresponding empty plasmid (pRS461-PA, rph1Δ). Cells were grown in rich selective medium (SMD-Ura) until mid-log phase and then starved for nitrogen for 1 h. (C) The stability of Rph1 mutants was analyzed by western blot with either an antibody that recognizes PA or anti-Pgk1 (loading control) antiserum. (D) The Pho8Δ60 activity was measured and normalized to the activity of wild-type Rph1 cells after 1 h of nitrogen starvation (−N), which was set to 100%. (E–F) Rph1-PA cells (WT, YAB366) and cells overexpressing Rph1-PA (OE Rph1, YAB363) or Rph1H235A-PA (OE Rph1H235A, YAB364) were grown in YPD (+N) until mid-log phase and then starved for nitrogen for 2 h (−N). (E) Protein extracts were analyzed by western blot with either an antibody that recognizes PA or anti-Pgk1 (loading control) antiserum. (F) The Pho8Δ60 activity was measured and normalized to the activity of wild-type cells after 2 h of nitrogen starvation (−N), which was set to 100%. (G) Rph1-PA binds the ATG7 promoter. rph1Δ cells transformed with the RPH1p-RPH1-PA (Rph1) or RPH1p-RPH1ΔZ-PA (Rph1ΔZ) plasmids were analyzed by ChIP. ChIP was conducted on the ATG7 promoter (ATG7p), a large non-coding region located at 260 kb on chromosome VI (ChrVI-260K) which was used as a negative control, and on the PHR1 promoter (PHR1p) which was used as a positive control. Results were normalized to the input DNA and calibrated to the ChrVI-260K PCR product; results are presented as fold-enrichment of Rph1 binding compared to Rph1ΔZ, which was set to 1. (See also Figure S3, Table S4 and Table S5.)
Figure 6
Figure 6. Rim15-dependent phosphorylation of Rph1 upon nitrogen starvation releases its repression on ATG gene expression and autophagy
(A–B) Rph1 is phosphorylated upon nitrogen starvation. Rph1 was chromosomally tagged with PA tag and Rph1-PA cells (YAB308) were grown in YPD until mid-log phase and then starved for nitrogen for the indicated times. (A) Protein extracts were analyzed by western blot with or without 50 μM Phos-tag as indicated and with either an antibody that recognizes PA or anti-Pgk1 (loading control) antiserum. Arrowheads indicate shifts in molecular weight of Rph1-PA suggesting phosphorylation. (B) Rph1-PA band shifts represent phospho-isoforms of the protein. Cells were lysed with or without phosphatase (Ppase) inhibitors. An aliquot of cell lysates was incubated at 30°C for 90 mintes in λ-phosphatase buffer with or without λ-phosphatase (λ Ppase). The reaction was stopped and proteins were precipitated by addition of 10% trichloroacetic acid. Protein extracts were analyzed by western blot as in (A) from gels containing Phos-tag. (C–D) Rph1 phosphorylation upon nitrogen starvation is blocked in rim15Δ cells. RPH1 was chromosomally tagged with PA in wild-type (WT) and rim15Δ cells. Cells were grown in YPD until mid-log phase and then starved for nitrogen for the indicated times. WT (YAB308) and rim15Δ cells (YAB341) were collected and protein extracts were analyzed by western blot with either an antibody that recognizes PA or anti-Pgk1 (loading control) antiserum. (D) Protein extracts were analyzed by western blot as in (B). (E) The deletion of RIM15 reduces the induction of ATG gene expression after nitrogen starvation. WT (YAB308) and rim15Δ (YAB341) cells were grown in YPD until mid-log phase and then starved for 1 h (−N). mRNA levels were quantified by RT-qPCR. The mRNA levels of individual ATG genes were normalized to the mRNA level of the corresponding gene in WT cells in nitrogen starvation condition (−N), which was set to 100. Data represent the average of at least 3 independent experiments ± standard deviation. (F) ATG7 was chromosomally tagged with PA in WT (YAB312) and rim15Δ (YAB342) cells. Cells were grown in YPD until mid-log phase and then starved for nitrogen for the indicated times. Protein extracts were analyzed by western blot with either an antibody that recognizes PA or anti-Pgk1 (loading control) antiserum. (G) ATG7 was chromosomally tagged with PA in WT (YAB312), rim15Δ (YAB342), rph1Δ (YAB313) and rim15Δ rph1Δ (YAB347) cells. Proteins extracts were analyzed as in (F). (See also Figure S4.)
Figure 7
Figure 7. KDM4 regulates autophagy in mammalian cells
(A) Transfected cells were grown for 48 h post transfection. Total RNA was extracted and the mRNA levels were quantified by RT-qPCR. The mRNA level of individual ATG genes was normalized to the mRNA level of the corresponding gene in the control cells (transfected with non-targeting siRNAs), which was set to 1. Error bars indicate the standard deviation of at least 3 independent experiments. (B) Left panel: HeLa cells transfected with siRNA against KDM4A (K4A) show a reduction in the expression of KDM4A and a concomitant increase in the LC3-II/LC3-I and LC3-II/actin ratio compared to the cells transfected with non-targeting siRNAs (control, C). In the presence of bafilomycin A1 (Baf), control and siKDM4A cells show a similar accumulation of LC3-II. Right panel: HeLa cells transfected with a plasmid overexpressing KDM4A (OE-KDM4A) show a decrease in the LC3-II/LC3-I and LC3-II/actin ratio compared to control cells (C). Total cell lysates were harvested 48 h after transfection and protein extracts were analyzed by western blot using antibodies to the indicated proteins. (C–D) Cells were transfected with the mRFP-GFP-LC3 plasmid. On the subsequent day, cells were transfected with siKDM4A (KDM4) or non-targeting siRNAs (control, C). Cells were treated for 24 h with DMSO or 250 nM Torin1 as indicated. (C) Cells were analyzed by fluorescence microscopy. Scale bar, 5 μm. (D) Autophagy was determined by quantification of the number of cells with LC3-positive organelles. The histogram represents the mean of 3 independent experiments with SEM. AL, autolysosomes; AP, autophagosomes; K4A, KDM4A. (E) KDM4A is degraded upon autophagy induction by Torin1. Cells were treated with 250 nM Torin1 for 24 h. Protein extracts were analyzed by western blot using antibodies to the indicated proteins. The average and standard deviation of 7 independent experiments are provided. (F) Phosphorylation of KDM4A at Tyr547 is upregulated by treatment with Torin1. Cells were treated with Torin1 and protein extracts analyzed by western blot as in (E). K4A, KDM4A; P-KDM4A/P-K4A, phosphorylated KDM4A.

Comment in

References

    1. Lenstra TL, Benschop JJ, Kim T, Schulze JM, Brabers NA, Margaritis T, van de Pasch LA, van Heesch SA, Brok MO, Groot Koerkamp MJ, et al. The specificity and topology of chromatin interaction pathways in yeast. Mol Cell. 2011;42:536–549. - PMC - PubMed
    1. Xie Z, Klionsky DJ. Autophagosome formation: core machinery and adaptations. Nat Cell Biol. 2007;9:1102–1109. - PubMed
    1. Tsukada M, Ohsumi Y. Isolation and characterization of autophagy-defective mutants of Saccharomyces cerevisiae. FEBS Lett. 1993;333:169–174. - PubMed
    1. Levine B, Klionsky DJ. Development by self-digestion: molecular mechanisms and biological functions of autophagy. Dev Cell. 2004;6:463–477. - PubMed
    1. Deretic V, Levine B. Autophagy, immunity, and microbial adaptations. Cell Host Microbe. 2009;5:527–549. - PMC - PubMed

Publication types

MeSH terms